How to Use Workflow Diagrams and Rendered Process Maps
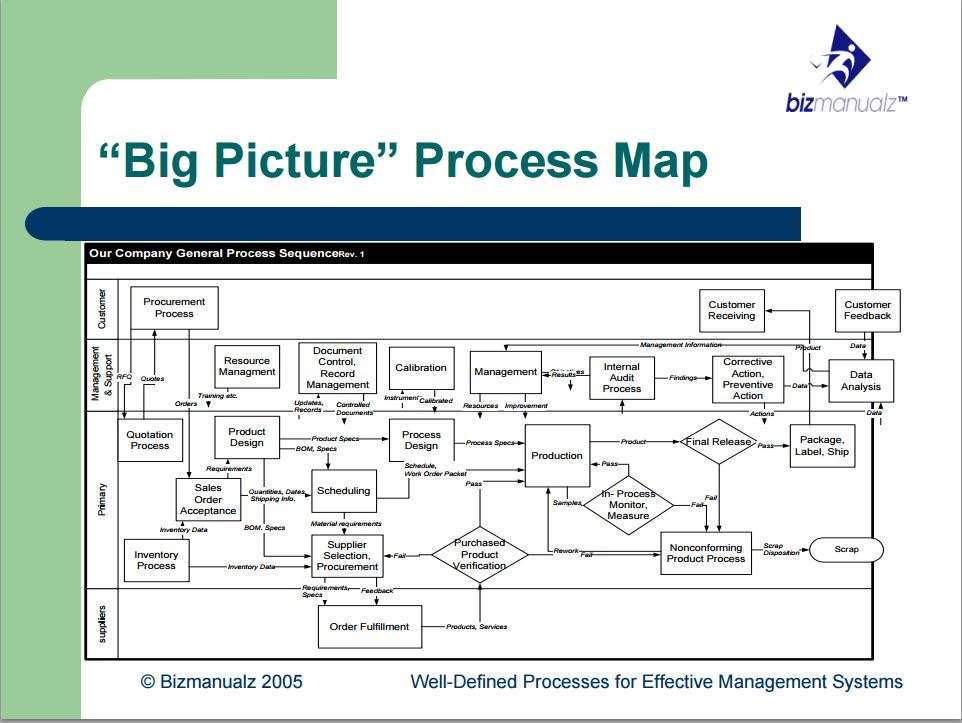
Workflow diagrams and rendered process maps help people see work the way it actually moves through a business. A procedure can be technically correct and still fail if the workers in the field cannot tell where the handoff, approval, delay, or responsibility sits.
That is why abstract UML symbols, squares and diamonds, and engineering notation often need to be translated into graphical images. This article explains how to use workflow diagrams and rendered process maps to make a business process visually clearer, more concrete, and easier to train.
What Are Workflow Diagrams and Rendered Process Maps?
Workflow diagrams are visual maps that show the steps, decisions, and movement of work through a process. They can use UML, or Unified Modeling Language, to represent activities with standardized symbols, but the point is not the notation itself. The point is to make the process easier to understand than a written procedure or engineering diagram alone.
A rendered process map goes further. It uses many of the same symbols, but adds graphics, color, images, labels, and environmental context so the viewer can relate the map to a real workplace. When a team has to understand a warehouse process, credit approval flow, purchasing handoff, or training sequence, a rendered map can make the abstract process feel less abstract and more concrete.
Process mapping can also support quality improvement, training, and standard operating procedure work. The National Institute of Standards and Technology describes process mapping as a way to improve efficiency, reduce errors, identify gaps, support root cause analysis, and help train new personnel. That same logic applies beyond forensic science whenever a business needs people to understand how work really flows.
How Do Workflow Diagrams Improve Task-Level Communication?
Workflow diagrams translate abstract UML symbols of squares and diamonds into graphical images that tell a more complete story than engineering notation communicates. Engineers and analysts may be used to thinking conceptually and using symbols, but workers in the field often need something closer to reality.
Task-level communications require clarity. A worker who sees only a policy paragraph may understand the rule but miss the handoff. A worker who sees a diagram can often spot the approval point, the next person responsible, the document used, and the decision that sends work down one path or another.
Microsoft Visio can be used to build workflow diagrams, and Microsoft PowerPoint can turn those diagrams into training materials for workers. The same map can also be redrawn as a swim lane process map when the team needs to communicate responsibilities more clearly.
Credit Approval Process
A credit approval process is a good example because the process includes requests, reviews, decisions, and possible rework. In a basic written procedure, those steps may be described in order. In a workflow diagram, the same process shows who acts, what decision happens, and where the work goes next.
Workers can see themselves in the workflow. They can see where a credit report is needed, when terms are approved, and where a request might return for more information. That makes the diagram useful for training, handoffs, and procedure reviews.

Figure 1: Credit Approval Process Work Flow Diagram
Workflow diagrams are more realistic than process flowcharts, but there may still be room for improvement. When a process depends on physical space, color-coded flows, waiting time, or different operational paths, a rendered process map can communicate more than a symbol-based diagram.
How Does a Rendered Process Map Add Context?
A rendered process map is similar to a workflow diagram. It uses many of the same symbols to communicate process flows and activities, but it is not limited to those symbols. Graphics, colors, and images can be combined to produce a more detailed and realistic map that everyone can relate to.
A graphics tool such as CorelDRAW can add more visual detail than a basic diagramming tool. The point is not to make the map decorative. The point is to show the business process visually in a way that connects the steps to the physical or operational environment.
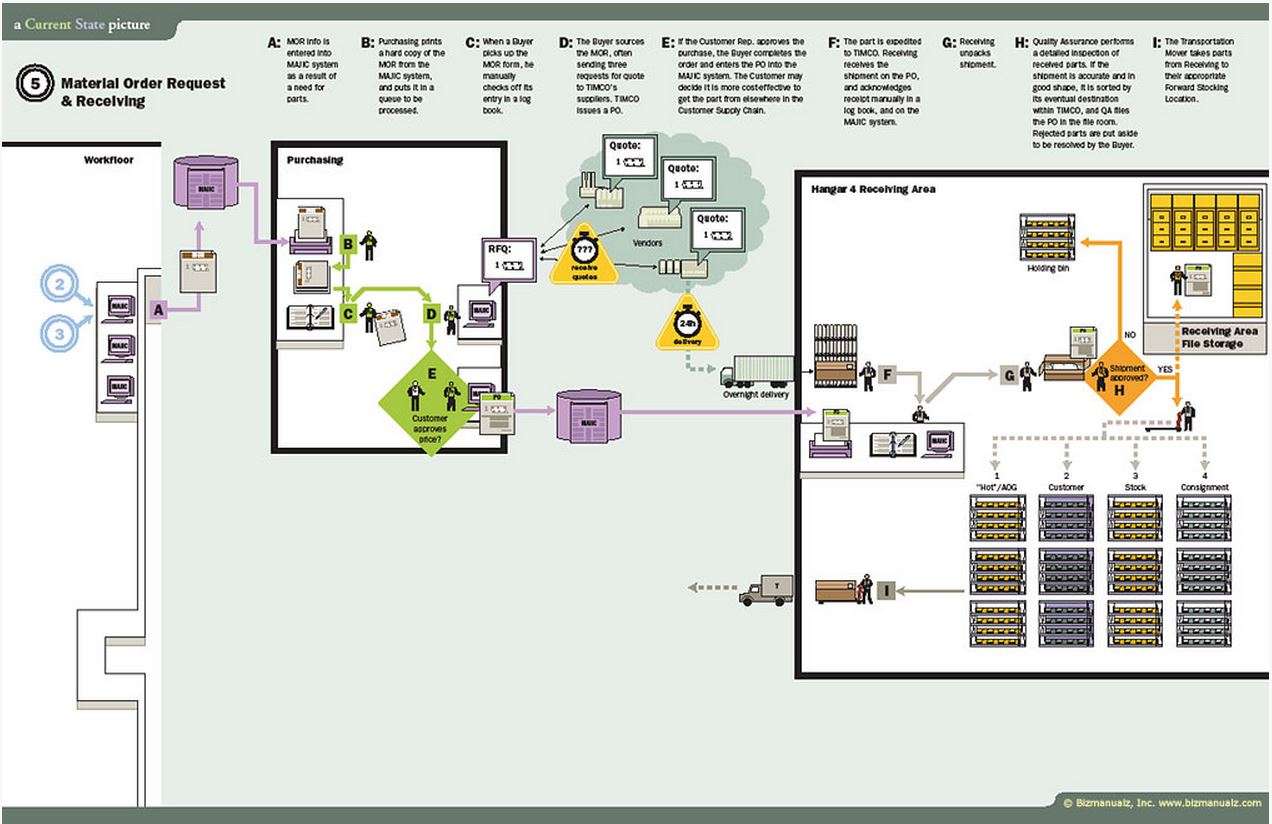
The material order request and receiving process is a good example. It depicts an inventory storage location or warehouse that is not physically at or near the point of sale. Activities are labeled A through I and are described at the top of the map.
Different process flows are color coded: green for customer approval within the purchasing sub-process, purple for distribution, grey for order processing, and orange for inventory picking. The orange triangles symbolize time waste, which helps people see where delay enters the process instead of only reading about it.

Figure 2: Material Order Request and Receiving Rendered Process Map
When Should You Use Each Type of Process Map?
There are many different types of process maps used in business process mapping. Each process map serves a specific purpose and works well in certain situations.
Use a workflow diagram when the team needs to understand steps, decisions, and handoffs. Use a rendered process map when the team also needs context, environment, color-coded process flows, or a closer connection to how work happens in the field. Use swim lanes when the biggest risk is unclear responsibility.
The right question is not which map is best in general. The right question is which map will make your company’s process easier to see, explain, train, and improve. If the map helps people run more efficiently and effectively, it is doing its job.
Frequently Asked Questions
What Is the Difference Between a Workflow Diagram and a Rendered Process Map?
A workflow diagram shows the steps, decisions, and movement of work through a process. A rendered process map adds more realistic context, such as graphics, color-coded flows, physical locations, and visual cues that help workers relate the map to the workplace.
Why Do Workflow Diagrams Use Squares and Diamonds?
Squares and rectangles commonly represent activities or tasks, while diamonds commonly represent decisions. These symbols help people read a process consistently, especially when the diagram follows UML or other standard process notation.
When Should a Business Use a Rendered Process Map?
A business should use a rendered process map when a basic diagram is too abstract for training, handoffs, or field communication. Rendered maps are useful when physical locations, color-coded paths, delays, or visual examples make the process easier to understand.
Can Workflow Diagrams Be Used for Employee Training?
Yes. Workflow diagrams can be used as a basis for employee training because they show how work moves from one step to the next. They can also be adapted into Microsoft PowerPoint training materials or combined with swim lane maps to show responsibilities.
How Do Process Maps Help Companies Improve Work?
Process maps help companies see the flow of work, decision points, handoffs, delays, and responsibility gaps. When the process is visible, teams can train more clearly, find waste, and improve how the company runs.