Help Teams Manage Change with Rendered Process Maps

Process maps are tools for you in your role as data collector and analyst: your role is to craft and communicate a story for change and improvement that people understand, accept, support, and will ultimately act on. As you move from gathering data about the current process to improving it, you need tools to help communicate your improvement plan and train participants on the new process, such as rendered process maps. They illustrate your plan by showing relevant facts that substantiate your point of view.
Rendered Process Maps
At the heart of your improvement plan should be a strategy. Rendered process maps can help you tell your story visually and represent the strategy. You need to paint an attractive picture — show a positive future, show the outcome that people will buy into.

We illustrated a strategy of faster turnaround for aircraft overhauls. It was simple. Workers could easily see how the changes being asked of them would result in good outcomes.
We helped an aircraft overhaul facility, or MRO, cut the time required for major service on aircraft overhauls. Less time in the shop means operators get their planes back in service faster which, in turn, means they make money instead of spending it. That helped the aircraft overhaul facility garner a competitive advantage. We mapped process flows and activities throughout the company; for example, how materials were specified, requisitioned, and tracked.
Positive Future a Reason to Change
For example, we selected and illustrated how highly skilled mechanics were spending time and many footsteps getting parts. Everyone understood that if a wrench doesn’t turn, the plane doesn’t move, and turnaround suffers.
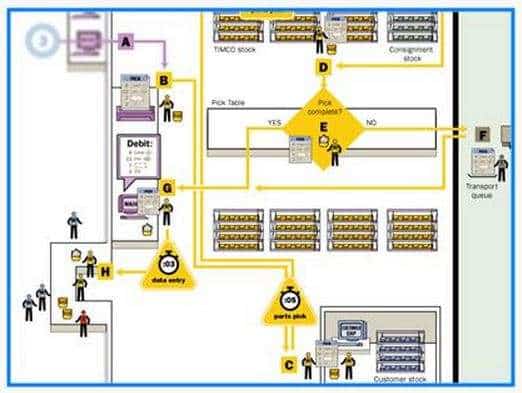
This rendered process map shows mechanics’ walk and wait times in the current state. Inefficiency and waste are readily apparent.
In the future state, we instead showed parts being delivered to the mechanics:
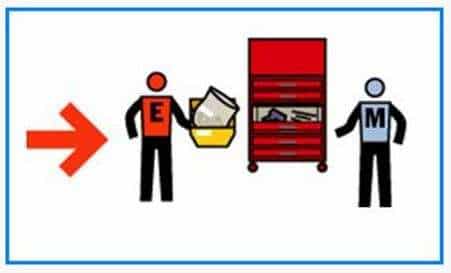
In contrast to the current state, the future state is much simpler and, therefore, a marked improvement. As a communications device, it leads workers to ask what is required to achieve and sustain the improvement.
How Small Changes Flow
With our process maps, the client saw how small changes would flow through the system and have a big impact. Had you asked department managers at the time, they would have told you they were already aware of most of the improvement opportunities that we identified. Certainly, the inefficiencies had been there for years, managers would have said. And point solutions had been identified in some cases. But the eventual impact of small changes was unclear or unknown, so it was hard for them to justify the time and resources needed to effect change.
Lighting a Fire for Change
So, improvement flagged. Lighting a fire for change meant we had to change minds. We illustrated an improvement story that showed certain small changes having a big impact. Using rendered process maps, we illustrated the strategy that was easy to buy into. We also illustrated a number of systemic improvements that would help sustain the improvements.
Visual Stories Help with Buy-In
It sounds simple, right? It was simple, and it tied in with the overall strategy of reducing turnaround. It made it a great story. Ultimately, it was the story that had been lacking in the past. The visual story, told in rendered process maps, helped us get the buy-in that was essential to support the many process changes required to sustain change.
How would the runner know what part to deliver to the mechanic? When would the part be delivered? How would chain of custody be maintained? Many questions arose that, before, simply froze out improvement, but by telling a story for positive change, the hard work of change became tenable.
Illustrating Specific Improvements
By virtue of our illustrating specific improvements using these process maps, people could see exactly how that lofty strategy translated into their daily work lives. Our story consisted of sufficient current-state and future-state improvement “concrete steps” and examples to show that improvement was, in fact, possible and exactly how the “positive future” of reduced turnaround time could be achieved.
Telling the Improvement Story
Had we stopped at producing the descriptive process maps and left it up to the department heads to structure an improvement program, they surely would have made some incremental improvements in their system. However, their efforts would have lacked urgency and sustainability. Change would not have happened fast enough to outpace the industry. Hungry competitors would not have been overtaken, and no sustainable competitive advantage would have been achieved. But it was achieved.
As we learned, it’s part of our job as leaders to tell the improvement story. Rendered process maps are a tool for telling stories of positive change. Fact-based, tangible, visual stories can illustrate a positive future, and should be in your process mapping toolkit. So, tell the story. Complete the improvement journey. Use a rendered process map to tell your story, visually.








What product are you using to render the process maps and is it automatically or manually done by the software?
We mainly use Visio to make most process process maps. You can use Excel for standard process maps. Rendered process maps require a drawing program, we used Adobe Illustrator.