What is the Duration of Continuous Improvement?

Many people wonder how long it takes to execute process improvement, a kaizen, or and continuous improvement program. That depends on your improvement objectives, where your are in the process, and what resources you have to work with. Find out what is the duration of continuous improvement programs?
How Much Time Is Needed for Process Improvement?
Do you know how long it should take your to achieve your target process improvement objectives? Or what resources you’ll will need to build your action plan? Once you do, you will be ready to set your objectives for real continuous improvement.
Process Improvement Half-Life
The time it takes to achieve 50% of the target is called the process improvement half-life.
The term “process improvement half-life” is another way of stating the diminishing returns that you will realize on your process improvement projects. The beginning of an improvement project is where you typically find the biggest waste; hence, the improvements are great! As time progresses, you find fewer big opportunities for improvement. You focus on ever smaller projects, with less impressive savings.
Process Approach
This dynamic is the process approach in the ISO 9001 quality standard and also referred to as the Plan-Do-Check-Act learning loop or ‘PDCA cycle‘, which is at the heart of any improvement process such as one for ISO compliance. Improvement teams cycle around the PDCA learning curve. With each new cycle the team identifies and eliminates the largest remaining root cause of defects, then moves on to the remaining sources of defects. As the team moves down the improvement learning curve their results diminish. This can be observed in the use of a Pareto Chart.
Pareto Principle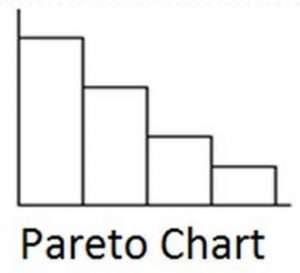
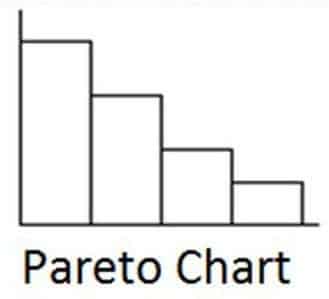
Vilfredo Pareto, who was an Italian engineer, developed the Pareto Principle (also referred to as the power law probability distribution or the “80/20 rule”), which states that 20% of the factors account for 80% of the effects. The Pareto chart is used to rank the factors (defects, causes, or data) in descending order from the most to the least significant. Pareto charts are one of the quality tools used for process improvement that help you visualize the “vital few” hiding among the “trivial many”. They are used within process improvement projects to determine where to focus your improvement efforts to obtain the largest impact.
Process Improvement Complexity
The actual improvement half-life is a function of the organizational or design complexity of your management systems. Processes with many steps, long cycle times, or that involve many people are complex and will require a lot more time.
For example:
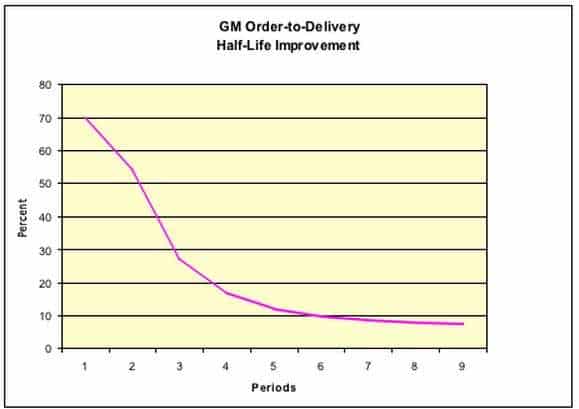 GM’s order-to-delivery cycle was 54 days in 2000. GM cut their order-to-delivery cycle by 50% by 2004. There goal is an order-to-delivery cycle of 7-10 days. How many periods are needed to achieve the goal?
The formula is simple. We add the goal (7 days) to half the difference between where we are today and the goal. In GM’s case they cut their order-to-delivery cycle from 54 to 27 days or by 50% in four years. So, in their next cycle of four years they will be at 17.
–1st cycle: 54 – 27 = 27 in 4 years
–2nd cycle: 7 + (27 – 7)/2 = 17
–3rd cycle: 7 + (17 – 7)/2 = 12
–4th cycle: 7 + (12 – 7)/2 = 9.5
–5th cycle: 7 + (9.5 – 7)/2 = 8.25
–6th cycle: 7 + (8.25 – 7)/2 = 7.625
–7th cycle: 7 + (7.625 – 7)/2 = 7.3125
To reach their goal of 7 to 10 days will take three more cycles or 12 years. We estimate their delivery cycle will go under 10 days in 2016. Of course GM’s real problem is that Toyota is at 12-15 days now, which means that Toyota has a 6-8 year learning curve lead on GM.
Process Improvement Skills

Active improvement will require support from top management, experienced change leaders and everyone else. Top management needs to be reasonably up-to-speed on the topics we have discussed regarding picking the right objectives.
Next, change leaders will be needed that are familiar with process improvement methods, tools and techniques such as six sigma, to recruit and facilitate change teams. And finally, everyone will need to be involved and committed in the whole process of change.
Improvement Action Plans
We have discussed the metrics to focus on; the business situations to involve and we should have a pretty good idea by now of whom we think needs to be involved. What we need is an Action Plan. The Plan identifies who does what by when to achieve each objective. We will list each step with a measurement point and utilize the Action Plan to monitor and achieve the objectives.
For example, let’s say we are going to increase sales 10% within 12 months. Then we will want to assign the tasks to specific individuals with a date and measure. The plan is used to communicate the schedule and responsibilities. The plan will contain our business metrics, the improvement half-life measures for milestones, and the individuals responsible for the action needed.
| Who | What | When |
|---|---|---|
| Bob, Marketing | Identify 9 potential customers | 14-Jan-04 |
| Bill, Sales | Close 1 customer for 25% plan | 31-Mar-04 |
| Bill, Sales | Close 1 customer for 50% plan | 30-Jun-04 |
| Bill, Sales | Close 1 customer for 75% plan | 30-Sep-04 |
| Bill, Sales | Close 1 customer for 100% plan | 31-Dec-04 |
Process Improvement Time Needed
If your business is organized for process improvement with the right amount of improvement skills and resources, then your time needs could vary. In general, the process improvement half-life suggest that your will need half the difference between where we are in the current state to get to the future state goal, so action plan accordingly to set the correct expectations.


Leave a Reply