
AS9100-D Data Analysis Continual Improvement Procedure Template Word

The AS9100-D Data Analysis Continual Improvement Procedure Template Word is a comprehensive tool designed to help organizations in the aerospace industry to improve their processes and products. This template is specifically tailored to meet the requirements of the AS9100-D standard, which is a quality management system standard for the aerospace industry.
The template provides a step-by-step guide on how to analyze data and identify areas for improvement. It includes instructions on how to collect data, how to analyze it, and how to use the results to make informed decisions. The template also includes a set of tools and techniques that can be used to analyze data, such as statistical process control charts, Pareto charts, and cause-and-effect diagrams.
The AS9100-D Data Analysis Continual Improvement Procedure Template Word is easy to use and can be customized to meet the specific needs of your organization. It is available in Microsoft Word format, which means that you can easily edit and modify the template to suit your requirements. The template is also fully compliant with the AS9100-D standard, which means that you can be confident that you are using a tool that meets the highest quality standards.
By using the AS9100-D Data Analysis Continual Improvement Procedure Template Word, you can improve the quality of your products and services, reduce waste and inefficiencies, and increase customer satisfaction. The template is an essential tool for any organization that wants to achieve excellence in the aerospace industry.
Aerospace Data Analysis Continual Improvement Procedure AS9100
The Data Analysis Continual Improvement Procedure AS9100 demonstrates the ongoing effectiveness of the company’s QMS. The procedure also determines where quality improvements can be made. It applies to the Quality Management System. (4 pages, 769 words)
Data Analysis Continual Improvement AS9100 Responsibilities
The Quality Assurance Manager is responsible for ensuring that QMS measurement data is analyzed.
Quality Management is responsible for analyzing data using appropriate techniques and reporting measurement data at periodic Management Reviews.
Department Managers are responsible for producing and using process monitoring and measuring data for the purpose of continually improving the Company’s QMS.
Data Analysis Continual Improvement AS9100 Definition
Control charts – Output of Statistical Process Control (SPC) calculations that derive the process variability from the mean to detect special cause variation.
Deming Cycle – The process-based improvement cycle, also known as the “Plan-Do-Check-Act” cycle, used or referred to in various quality standards (including AS9100).
Pareto diagrams – Histogram chart method that ranks data high to low to separate the vital few from the trivial many. Also know as the 80/20 rule.
Special cause variation – Product/process variation, caused by an unusual or unexpected event that can be determined. Not random.
Trend or run charts – chart method that plots process output over time.
Data Analysis Continual Improvement Procedure AS9100 Activities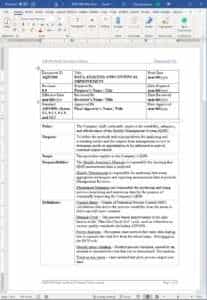
- Aerospace Data Collection
- Data Analysis
- Continual Improvement
Aerospace References
- AS9100:2016 Rev D, “Quality Management Systems – Requirements for Aviation, Space, and Defense Organizations”, SAE International, Sept., 2016.
- Quality Procedures
- AQP1040 Nonconformity and Corrective Action
- AQP1060 Management Review
- AQP1070 Competence Awareness
- AQP1120 External Provider Evaluation
- AQP1180 Monitoring-Measurement
- AQP1190 Customer Satisfaction


Reviews
There are no reviews yet.