What is the Goal of Value Stream Map Analysis?
A value stream map can look complete while still hiding the delays, handoffs, excess movement, inventory, and rework that keep work from flowing. The first pass shows the broad route. The second pass tests what actually happens at each step, which activities create customer value, and where barriers to flow remain.
Start with the rough map, metrics, flows, and constraints captured during a first-pass assessment. Then deepen the current state, analyze space and material movement, draw a practical future state, and rank the improvement opportunities. The point is to finish your value stream map analysis with enough evidence to act without losing momentum.
What Is Value Stream Map Analysis?
Value stream map analysis is the structured review of material flow, information flow, process time, waiting time, inventory, constraints, and customer value across an end-to-end process. It turns a map from a picture of work into a shared diagnosis of the current state and a plan for a better future state. The National Institute of Standards and Technology’s value stream mapping guidance describes the same progression: map the current state, diagnose problems, identify improvement opportunities, define a future state, and implement improvements.
The second-pass assessment is like peeling away the layers of an onion. Uncover each layer one at a time so the team does not miss the barriers to flow. Go too fast and people may not understand what they are looking at or notice how work actually moves. Continual improvement over delayed perfection keeps the analysis moving without letting the team get caught in analysis paralysis. This is part of the Lean practice of learning to see.
Work at the speed of the employees, not the speed of the Lean expert. The people who perform the process need time to experience the evidence, challenge assumptions, and help shape the change. When an expert tries to turn the organization upside down too quickly, quiet or open resistance can push the work back toward the status quo. A strong analysis builds understanding as well as a map.
The second pass should produce five connected deliverables:
- More detail on the Current State Value Stream Map.
- A Visual Space Analysis.
- A Material Flow Analysis.
- A Future State Value Stream Map.
- A ranked list of improvement opportunities.
How Do You Build a Detailed Current State Value Stream Map?
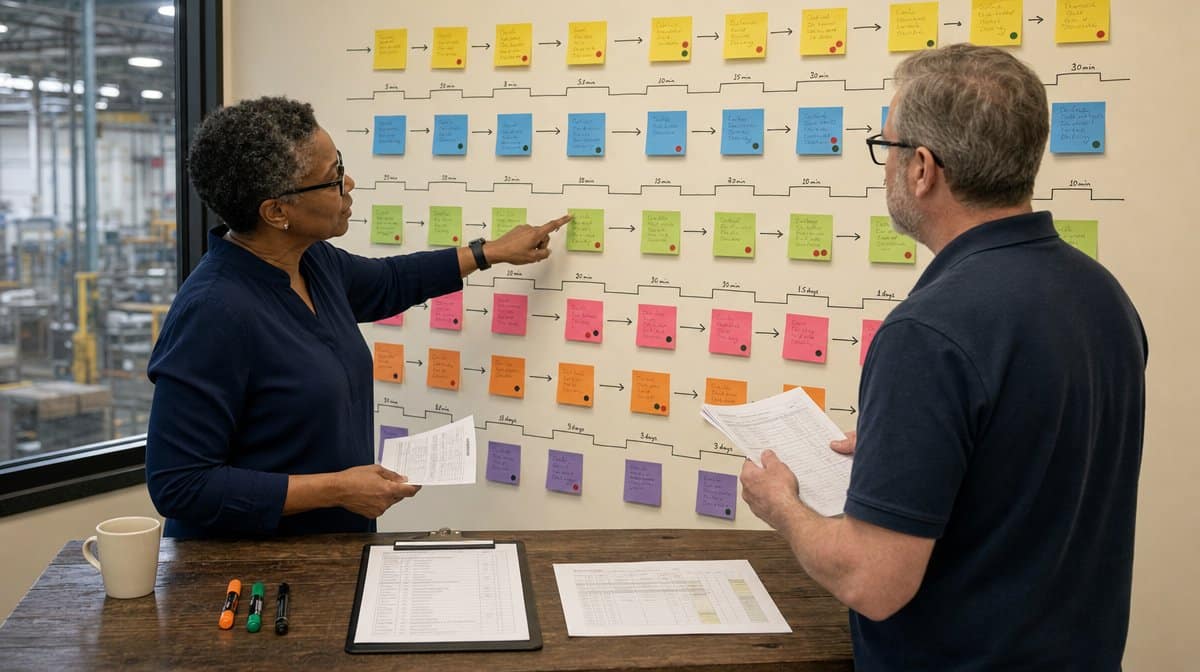
The first pass collects high-level data for a value stream map, which is a form of process map. The second pass adds low-level evidence. Gather representatives who do the work in a large room, hand out medium-sized Post-it notes, and ask each person to write down the tasks involved in processing an order into a shipped product.
Post the notes on the wall in process order. The steps may be grouped as sales, order entry, scheduling, purchasing, manufacturing, staging, shipping, and billing, or the team may narrow the scope and break manufacturing into its individual steps. The right level depends on the improvement boundary.
The result is a multicolored description of the process. Add the time required for each task, then discuss whether each activity creates value, fails to create value, or is required even though it does not transform the product or service. The discussion matters as much as the dots because it reveals where departments use different definitions of value.
How Do You Classify Value-Added and Non-Value-Added Work?
One of the most critical steps is understanding Lean waste. Value is defined by the end customer. An activity is value-added when it changes the product or service in a way the customer requires, is performed correctly the first time, and contributes directly to an outcome the customer is willing to pay for. An activity that does not meet those tests is non-value-added, although some non-value-added work remains necessary for compliance, safety, risk, or control.
Evaluate every task on the wall. Put a green dot on value-added work, a red dot on non-value-added work, and a black dot on required non-value-added work. The black category prevents the team from treating every control or compliance step as disposable. It also invites a better question: can the required work be simplified, combined, automated, or moved so it creates less delay?
How Do You Assess Transformational Effectiveness?
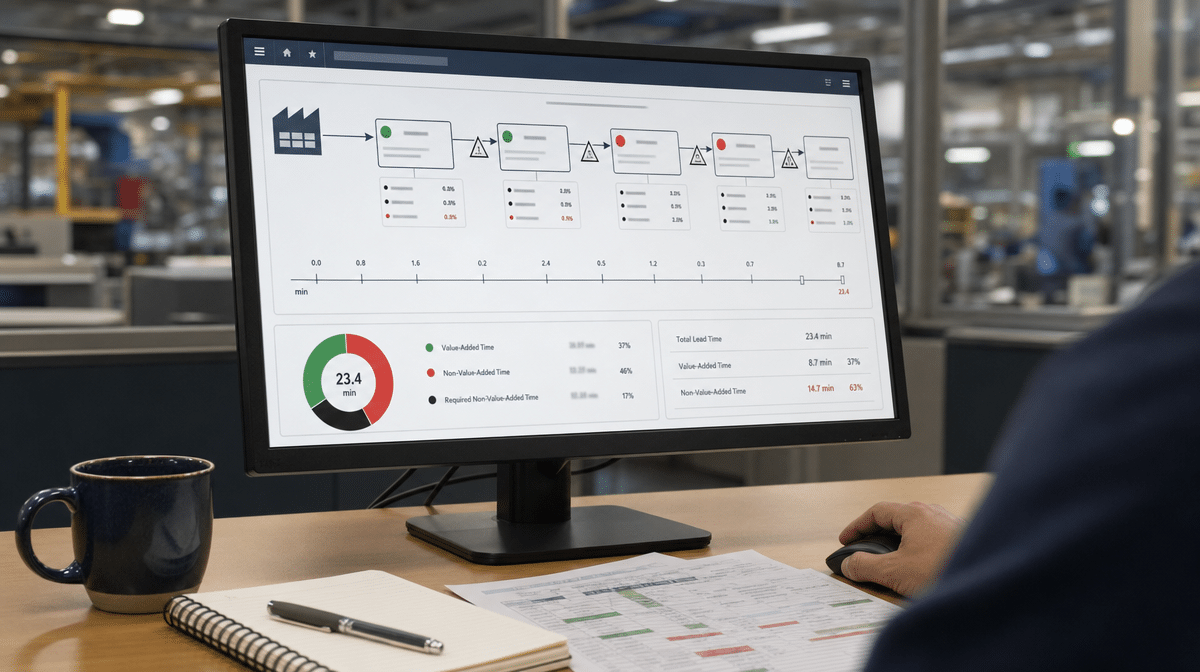
Count the dots and total the times. In this workshop example, the process has 51 tasks: 8 value-added, 37 non-value-added, and 6 required non-value-added. Eight of 51 tasks is about 16 percent, but that task-count share is not the same as Transformational Effectiveness. The effectiveness calculation uses time:
Transformational Effectiveness = Value-Added Time / (Value-Added Time + Non-Value-Added Time)
The visual can change how participants understand their jobs. They see how much effort is spent waiting, moving, checking, correcting, or handling work that does not create customer value. That evidence supports getting buy-in for change, but leaders should connect efficiency gains with growth, redeployment, and workforce planning. Otherwise the fear described by the Iron Law of Layoffs can undermine participation.
At this point, people can see waste on the wall instead of hearing an expert insist it exists. Ask whether the process can improve and the answers will usually be more specific than they were before the exercise. The map has begun to change the team’s thinking.
How Do You Propose New Solutions?
The second-pass assessment captures a more detailed view of metrics, flows, and constraints. Add total orders per day, available production time, downtime, setup time, scrap rate, inventory, queue time, and the number of employees. The American Society for Quality’s value stream mapping guidance recommends collecting current-state evidence where the work happens, including cycle time, changeover time, reliability, first-pass yield, quantities, operators, inventory, and waiting time.
Use this information to finish the current-state map before jumping to a preferred solution. A detailed current state helps the team distinguish a local symptom from a system constraint and creates a more reliable basis for the future state.
How Do You Perform a Visual Space Analysis?
Stop and ask whether the floor space supports value-added work. A Visual Space Analysis tests how effectively the plant layout is being used. Shade or block the space by category on a plant layout or CAD drawing:
- Raw Material: orange.
- Work in Process: blue.
- Finished Goods: red.
- Tooling: brown.
- Aisles: yellow.
- Offices: purple.
- Empty Space: white or pink.
- Value-added activity: green, including the working space around a cell.
Calculate the square footage used by each category and place the results in a pie chart. The visual may reveal that raw material, work in process, storage, aisles, or other non-value-added uses occupy more space than leaders expected. That finding can point to layout, inventory, or flow changes that are difficult to see in a process map alone.

How Do You Analyze Material Flow?
Create a Material Flow Analysis, also known as a spaghetti diagram, by following raw material through the plant until it becomes finished goods. Use another copy of the CAD drawing and draw a line for every material movement. Place a triangle at each point where material stops.
A poorly organized functional layout often produces tangled lines, backtracking, repeated handling, and many stoppages, which is why the diagram begins to resemble spaghetti. A plant organized around value streams should show cleaner flow lines and fewer stops. Measure travel distance and waiting points so the team can compare the current route with a proposed layout rather than relying on visual impression alone.

How Do You Draw a Future State Value Stream Map?
The Future State Value Stream Map describes the desired way material and information should flow. It should contain fewer unnecessary steps and handoffs, less inventory, simpler information flow, and shorter lead times than the current state. It is a practical target, not a decorative ideal.
In Lean process improvement, examine process interfaces and customer touchpoints for waste production, introduction, and handling. Then reduce or eliminate the non-value-added work while protecting the controls that remain necessary. The future-state map should make those choices visible and connect each change with the constraint it addresses.

How Do You Rank Improvement Opportunities?
Compare the future state with the current state and mark each gap with an improvement starburst. The original example identifies four opportunities:
- Design a Lean kanban system for raw materials.
- Reduce lot size and setup time.
- Redesign the work cell.
- Design kanban for finished goods.
Estimate the potential cost reduction, lead-time effect, quality effect, customer impact, implementation effort, and probability of success. Then rank the improvement opportunities against the same criteria. The fastest solution is not always the smallest project. It is the improvement that produces useful evidence, builds confidence, and removes a meaningful barrier to flow without requiring a long period of analysis.
| Improvement Opportunity | Baseline to Record | Expected Effect to Test | Planning Question |
|---|---|---|---|
| Raw Material Reduction | Inventory quantity, days on hand, storage space | Less cash and floor space tied up in material | Can supply remain reliable at a lower inventory level? |
| Work in Process Reduction | Queue quantity, waiting time, total lead time | Faster flow and earlier problem detection | Which constraint causes work to accumulate? |
| Finished Goods Reduction | Finished inventory, demand variation, service level | Lower storage cost without harming delivery | What buffer is required for actual customer demand? |
| Material Flow Reduction | Travel distance, moves, stops, handling time | Less motion, handling, damage, and delay | Can layout changes shorten the route safely? |
| Vendor Base Reduction | Supplier count, performance, risk, transaction load | Simpler coordination and stronger supplier focus | Would concentration create an unacceptable supply risk? |
| Productivity Increase | Output, labor time, downtime, first-pass yield | More good output from the same capacity | Does the change remove waste or merely increase work pace? |
| Improved Quality | Scrap, rework, defects, returns, first-pass yield | Less failure demand and more reliable flow | Which process condition creates the defect? |
| Setup Reduction | Changeover time, batch size, lost production time | Smaller batches and greater scheduling flexibility | Which internal setup steps can move outside downtime? |
What Is the Goal of Value Stream Map Analysis?
As a team implements Lean, the focus should not remain on the tools. The map, colored dots, floor-space chart, and spaghetti diagram help people change how they see the work and what the customer needs. Look for solutions that increase flexibility and create a more agile system instead of forcing customer demand into the existing process through minimum order quantities, quantity price breaks, or long delivery waits.
Focus the organization’s metrics on process capability, customer value, lead time, quality, and flow. Thinking governs performance. If the team changes a diagram without changing how it recognizes waste and responds to constraints, it has not fully implemented Lean. The goal of value stream map analysis is to change the thinking, learn to see the flow, reduce barriers to flow, and make the business run more smoothly and efficiently.
Frequently Asked Questions
What Is the Goal of Value Stream Map Analysis?
The goal is to understand current material and information flow, identify barriers and waste, define a better future state, and turn the evidence into ranked improvement action.
How Do You Identify Value-Added and Non-Value-Added Work?
Test whether the activity creates an outcome the customer requires and would pay for, changes the product or service, and is performed correctly the first time. Separate non-value-added work from required non-value-added controls.
What Is Transformational Effectiveness?
Transformational Effectiveness is the share of observed process time spent on value-added work. Divide value-added time by the sum of value-added and non-value-added time.
Why Use a Spaghetti Diagram in Value Stream Analysis?
A spaghetti diagram traces material travel and stopping points across the facility. It makes backtracking, repeated handling, excessive distance, and layout constraints visible.
How Should You Rank Improvement Opportunities?
Rank opportunities by baseline evidence, customer impact, lead-time and quality effect, cost, effort, risk, ownership, and probability of success. Favor improvements that remove meaningful constraints and build confidence without extended analysis.