What are Performance Metrics Examples?

Leaders cannot improve a system they cannot see. Ask what makes a good performance metric, and the honest answer is that it depends on the purpose of the business and the work that creates value for customers.
The right measures turn that purpose into visible targets. They show whether speed and flow are improving, whether work is accurate, and whether the organization has the capacity to meet demand before revenue, profit, or cash flow confirms what already happened.
What Are Performance Metrics?
Performance metrics are recurring measures used to monitor a process, output, or outcome against a defined purpose or target. They give leaders a consistent way to see how work is moving, where it is waiting, and whether the result meets customer requirements.
A useful metric must support a decision. NIST’s guidance on performance measurement recommends measures that address strategic and operational performance, inform resource allocation, and include both leading and lagging indicators. That makes the selection test practical: if a measure does not change a decision or prompt an action, it may not belong on the leadership scoreboard.
Which Performance Metrics Fit the Business?
What do your business metrics say about your business? Management leadership is about refusing to settle for less, but that requires a target that defines the performance the organization wants.
This article uses three operating contexts to show why the answer changes: manufacturing without research and design, manufacturing with research and design, and a service organization. These are not the only business models. They are useful examples because each places different demands on inventory, information, accuracy, customer value, and end-to-end times.
Manufacturing Metrics Without Design
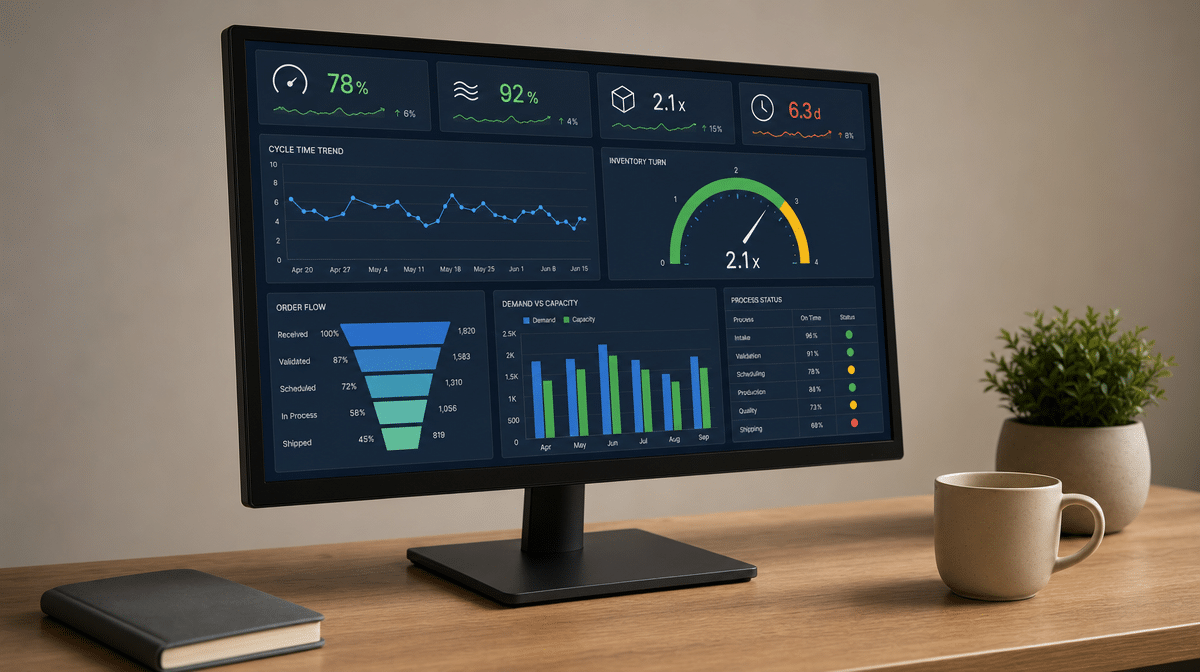
The first speed and flow metric for many manufacturers is inventory turns. Inventory turns are a composite measure of purchasing, manufacturing, and sales or marketing cycles. They show how often inventory is sold or used during a period and whether material is moving through the system.
Higher turns are not automatically better if shortages, defects, or emergency purchases rise with them. The measure becomes useful when it is read with service, quality, and delivery results. Sustainable improvement comes from eliminating delays, bottlenecks, excess work in process, and inefficient processes rather than simply cutting stock.
Order-to-Delivery Time
The second composite measure is order-to-delivery time. Define the endpoints before comparing results: one organization may measure from order receipt to shipment, while another measures through customer receipt. Either definition can work, but it must stay consistent.
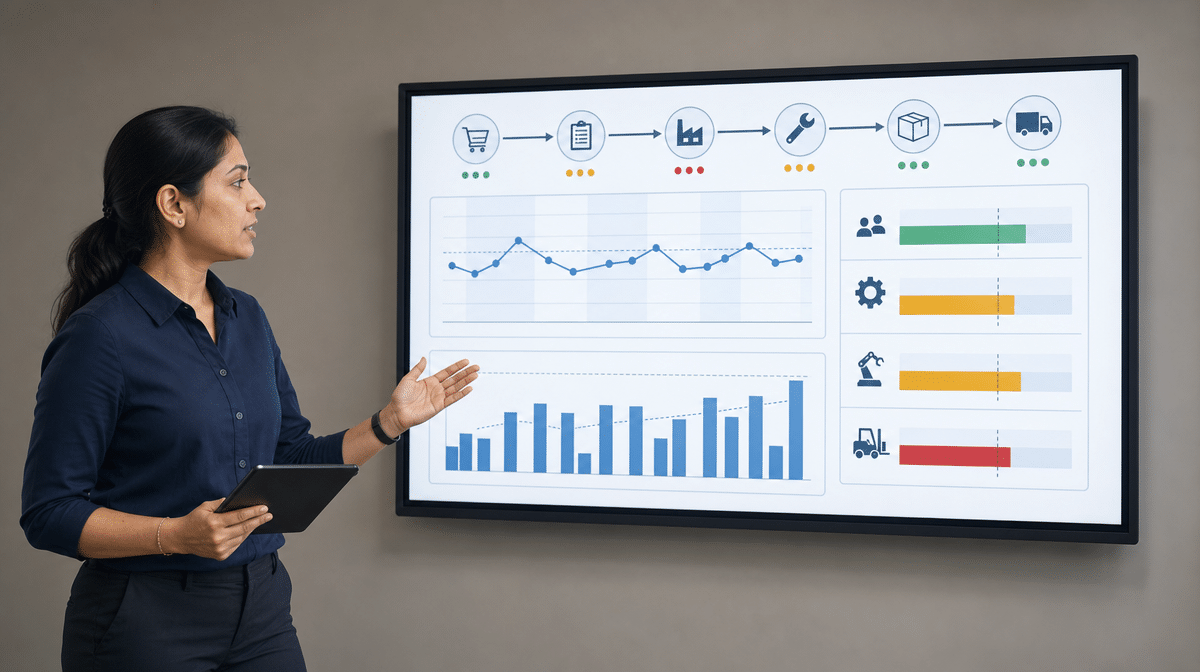
Order-to-delivery time brings material and information flows into one view. Material flow appears in inventory turns. Information flows include IT policies, sales, marketing, order entry, purchasing, scheduling, quality assurance, and picking and packing for shipment.
For many companies, information moves quickly only to the next queue. It then sits waiting for someone to touch it and move it to the next person. That waiting time can matter more than the processing time itself.
Order-to-Delivery Cycle
How long is the order-to-delivery cycle? It is common to find five-, eight-, or 15-day order-to-delivery cycles even when the manufacturing process is simple enough to make the product in less than one day. The difference is often a trail of approvals, handoffs, scheduling gaps, and information queues.
Cycle time is therefore a leading indicator. It exposes a cause that leaders can work on today. Revenue and margin report the result later, after the delays have already shaped customer experience and cash timing.
Which Metrics Matter When Manufacturing Includes Design?
Accuracy Against Customer Requirements
A manufacturer that performs research and design should add accuracy to inventory turns and order-to-delivery measures. Accuracy means conformance to customer requirements: the design solves the intended problem, specifications are correct, and changes do not create avoidable rework downstream.
Possible measures include first-pass design approval, engineering change frequency, defects traced to design, and the percentage of requirements verified before release. The exact measure depends on the product, but each should reveal whether design information is right before production commits material and time.
Customer Value
Customer value asks whether the result is useful relative to its cost, quality, and delivery time. A team can hit an internal schedule and still miss the customer’s real need. Pairing accuracy with customer feedback, adoption, returns, warranty claims, or repeat orders keeps design performance tied to the organizational purpose.
Which Performance Metrics Matter for Service Organizations?
Service organizations usually do not manage physical inventory in the same way, but they still have order-to-delivery times, accuracy, and customer value measures. Focus on end-to-end times for the service process in question, such as request to resolution, application to approval, or appointment to completed follow-up.
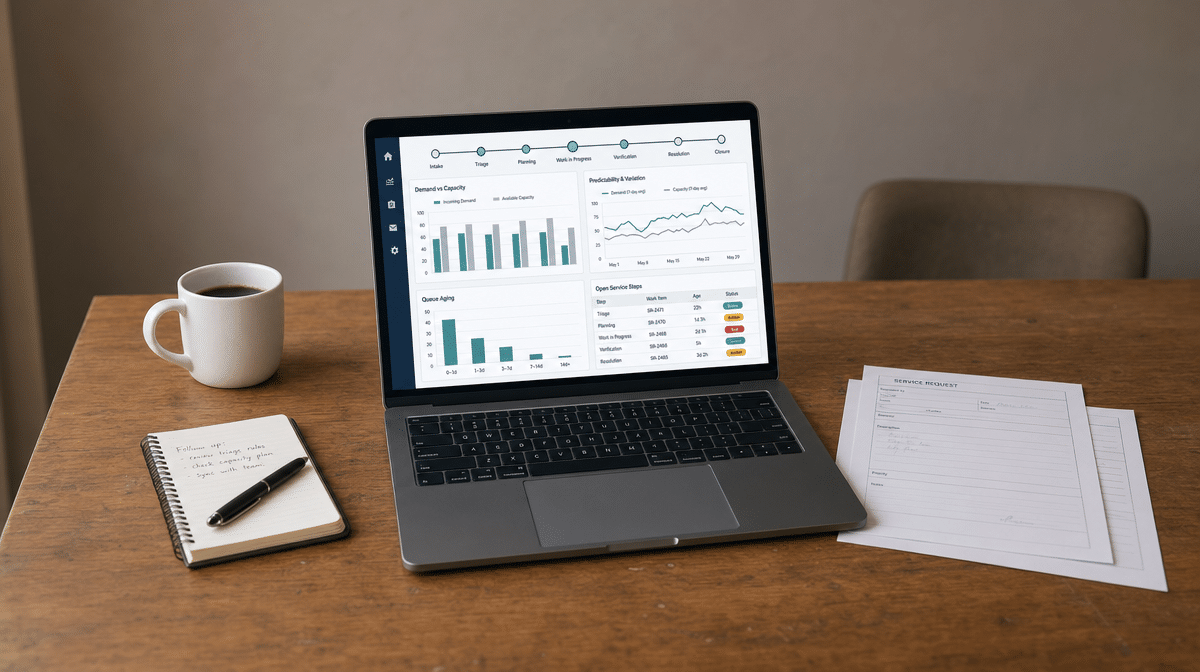
Average time alone can hide the problem. A service team should also watch variation, aging queues, first-time-right performance, rework, and the share of requests completed within a meaningful customer promise. These measures reveal whether a fast average depends on leaving difficult work behind.
Accuracy and customer value keep the cycle-time goal honest. Speed that creates errors, repeat calls, or incomplete work is not flow. The best service metrics balance time, quality, and the outcome the customer needed.
How Should Leaders Use Organizational Metrics?
Customer Demand, Internal Capacity, and Process Capability
Most companies benefit from measures for customer demand, internal capacity to meet that demand, and process capability, which is the predictability of performance. Read together, these measures show whether the system can absorb demand without creating longer queues, rushed work, or inconsistent quality.
Demand without capacity creates waiting. Capacity without demand creates waste. A capable process produces a stable result within known limits, giving leaders a reliable basis for staffing, scheduling, investment, and improvement.
Revenue, Profit, and Cash Flow
Revenue can become management’s vanity, profit management’s pride, and cash flow management’s lifeblood. All three matter, but they are lagging indicators of performance. They tell leaders what happened after customers ordered, employees worked, suppliers delivered, and processes either flowed or waited.
Accrual revenue and profit are not illusions, but they can obscure timing and do not by themselves explain operational causes. The U.S. Small Business Administration’s accounting guidance distinguishes accrual accounting, which records a completed sale before payment arrives, from cash accounting, which records it when payment is received. That timing difference is one reason a profitable company can still face a cash constraint.
You cannot pay employees and suppliers with revenue or profit alone. You pay them with cash. That is why cash flow deserves close attention, while the operational causes of cash performance still require leading indicators such as speed, flow, quality, demand, and capacity.
What Are Practical Performance Metrics Examples?
Start with organizational purpose, then choose the smallest balanced set that helps leaders make decisions. For a manufacturer, that set may begin with inventory turns and order-to-delivery, then add first-pass quality, accuracy, and customer value. For a service organization, it may begin with request-to-resolution time, queue aging, first-time-right completion, demand, and capacity.
Each measure should have a clear definition, owner, data source, review frequency, and response when performance moves outside the target. Leaders should also watch for distortion. A team pressured to optimize one number can improve the metric while harming the system, so speed must be read with quality, cost, and customer outcomes.
The sequence remains practical: start with inventory turns, add order-to-delivery, then add accuracy and customer value. Each step looks at end-to-end cycle time and the conditions that create it. When measures help increase speed and flow while achieving organizational purpose, they become tools of organizational leadership, not just numbers on a report.
Financial outcomes still confirm whether the system is sustainable. The improvement work begins earlier, with leading indicators for measuring organizational success that expose delays, bottlenecks, information queues, and changing demand before yesterday’s results become tomorrow’s problem.
Frequently Asked Questions
What Are Performance Metrics?
Performance metrics are recurring measures that track a process, output, or outcome against a defined purpose or target. Useful metrics help leaders make a decision or take action.
Which Performance Metrics Should Manufacturers Track?
Manufacturers commonly track inventory turns, order-to-delivery time, quality, accuracy, customer value, demand, capacity, and process capability. The right set depends on the organization’s purpose and operating model.
How Is Order-to-Delivery Time Measured?
Measure from a consistently defined starting point, usually order receipt, to shipment or customer receipt. The metric should include both material flow and the information queues that support the order.
Which Metrics Matter for Service Organizations?
Service organizations should track end-to-end service time, queue aging, first-time-right completion, demand, capacity, accuracy, and customer value. These measures balance speed with quality and the customer’s intended outcome.
Why Are Leading Indicators Useful for Improvement?
Leading indicators reveal operating causes such as cycle time, delays, bottlenecks, demand, and capacity before financial outcomes are final. Lagging indicators such as revenue, profit, and cash flow confirm results after the work has occurred.