How Simple Visual Stories Convey Your Message Effectively

A visual story helps you convey your message by replacing a crowded field of symbols and shapes with a sequence people can follow. Instead of asking the audience to decode your diagram, show who has a problem, what happens next, and what useful outcome follows. That is how simple visual stories can convey a message effectively.
This approach supports building a visual brand, but it is also useful for internal explanations, process changes, training, and visual management. The practical goal is not to decorate a presentation. It is to make the message story clear enough that the audience knows what the visual means and what to do next.
How Do You Communicate with Visual Stories?
What happens when an engineering approach is applied to business communications? An engineering approach might call for deconstructing complex ideas into symbols, then reassembling the elements. Technologists often take the same approach when explaining what they do for customers.
You may have received a chart jammed with squares, circles, globes, arrows, and lines. The person who made it may have reduced the work to its essence and expected the receiving audience to reconstitute the message from the symbols. The diagram may be accurate while still requiring too much interpretation.
Relevant pictures, drawings, charts, graphs, and diagrams can make complex information easier to comprehend and can reinforce written or spoken messages, according to the CDC visual communication guidance. The guidance is written for health communication, but its design principle is useful here: the visual must support the main message and use clear headings, labels, and captions.
Show People How You Can Help Them
Start with a concrete audience problem instead of a library of abstract symbols. Add the people or roles involved, show their interaction with a familiar object or process, and end with a visible benefit. This gives the audience a cause-and-effect sequence rather than a puzzle.

The original visual-stories PDF shows how a dense engineering explanation can become a more direct value story. Use it as a convey-a-message example: identify the customer, show the interaction, and make the delivered value visible.
Get Away From the Abstract
Getting across the flow of time, the relationships between events, or their relative importance assumes that your audience understands your symbolic language. If not, you may need translation services or a shared glossary. Symbols do not carry the same meaning for every audience, so connect them to familiar people, objects, labels, and actions.
The CDC also warns that people can interpret visuals in different ways. That is why a visual story needs enough context to guide interpretation without becoming another overloaded diagram. Ask someone outside the project to explain the story back to you. If the explanation changes, the visual needs a clearer sequence or label.
Listen to the Story
Before a technologist could construct the boxes, circles, arrows, and lines, that person had to assemble a narrative about how, when, and why things happened. In short, the story existed before the diagram. Listen for that story before choosing the visual form.
Write the narrative in plain language first. Who is trying to do what? What gets in the way? Which action changes the situation? What outcome proves that the action helped? These questions expose the sequence that the visual needs to show.
Everyone Speaks in Stories
Stories can make a business explanation easier to follow, but avoid treating that benefit as universal. A meta-analysis of narrative and expository texts covering more than 75 unique samples and more than 33,000 participants found that narratives were, on average, better understood and recalled than expository texts. That evidence concerns narrative texts, not every visual-story format or every audience.
For a business visual, show interaction among characters or roles. Include objects that have intrinsic meaning for your audience. Show benefits being delivered, even when the scene is metaphorical. Organize the story in time or space, and you can show people what you do without forcing them to reconstruct the idea from disconnected symbols.
How Can You Build a Simple Visual Story?
Use five decisions to turn a complex message into a simple visual story:
- Name the audience and task. State who needs to understand or act.
- Choose familiar characters and objects. Use roles, tools, documents, products, or places the audience already recognizes.
- Show a sequence. Arrange the problem, action, interaction, and outcome in time or space.
- Make the benefit concrete. Show what becomes easier, faster to notice, safer, clearer, or more reliable without inventing a performance claim.
- End with the next action. Tell the audience what to review, decide, or do after seeing the story.
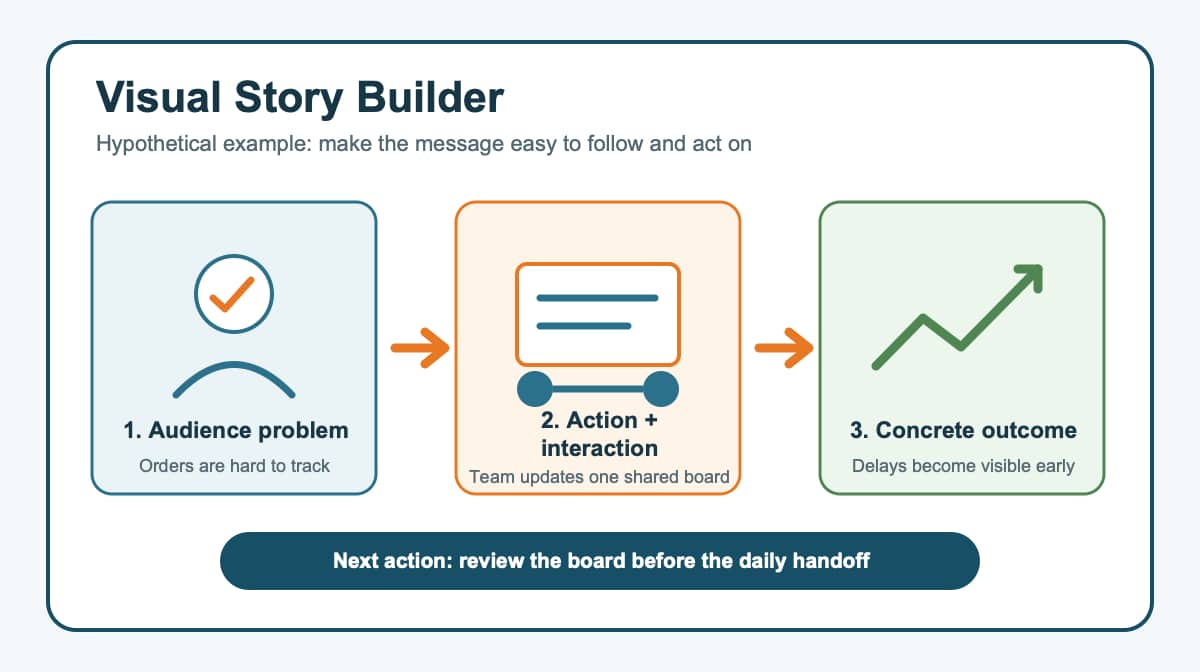
This hypothetical example starts with an audience problem: orders are hard to track. The action and interaction are simple: the team updates one shared board. The concrete outcome is that delays become visible early. The next action is to review the board before the daily handoff. The nearby words and visual convey the same message and reinforce each other, which is the test recommended by the CDC Clear Communication Index.
Check the Visual Before You Share It
Remove any shape that does not help the audience follow the sequence. Confirm that each arrow has one clear direction and that each label uses the audience’s language. Make sure the words and visuals do not contradict one another. Finally, ask a representative reader to describe the message and next action without coaching.
How Do Visual Stories Support a Visual Workplace?
The same method can make workplace standards, progress, and process outcomes easier to act on. Distinguishing value versus waste, showing strategic intent, and communicating process outcomes are important elements of visual management. A visual workplace communicates what is important, who owns the next action, and when a result needs attention.
Characteristics of a Visual Workplace
- Clearly communicates needed information
- Clearly reflects established standards
- Clearly identifies behavior or process targets
- Clearly is low cost and easy to use
Involving the actual users in the measurements is the first step to building a visual workplace. Provide results in a form appropriate for your audience. Report data in time to reach the people who can act on it. Spreadsheets and dashboards are useful electronic tools for visual management only when the information is visible, understandable, and connected to a decision.
A visual workplace can support improvements to a quality system by making standards, current conditions, and deviations easier to notice. It does not sustain improvement by itself. Ownership, regular review, and corrective action are still necessary to prevent backsliding.
A simple scoreboard can provide a practical starting point for visual management. Process metrics, descriptions, and historical data can translate company vision into the daily execution of strategy implementation. Keep the scoreboard focused on the few measures that prompt a useful response.
How Do You Convey Your Message Effectively?
Communicating with visual stories can simplify a message that would otherwise be complicated by symbols and shapes. Get away from the abstract, listen for the narrative that existed before the diagram, and show the audience a recognizable problem, interaction, outcome, and next action. When the story and the visual support one another, people have a clearer path from seeing the message to using it.