What Operational Metrics are Used to Run a Business?

Tracking operational metrics is an excellent place to start to keep watch on how your business is running! What gets measured, gets managed; but, what should you measure? There are many operational metrics that you should be measuring to enhance operations and keep your business working. Read on to find out what operational metrics are uses to run a business?
What Do Your Business Metrics Say About Your Business?
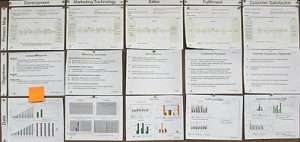
The Bizmanualz Scoreboard displays key segment processes, clearly stated objectives, and on-going performance metrics
Trends are good things if they are planned for or a result of actions you initiated. Good or bad Trends that you have no idea why they are happening are a bad thing and require investigation. Yes, even good business metrics have patterns or trends that require investigation. Trends that magically rise can also magically fall. Businesses don’t run on magic.
Do your trends suggest it’s time to adjust your targets? KPIs which are being met consistently for 90 days or more can be an opportunity to raise your targets to reach higher goals. Alternatively, business metrics you are failing to meet for 90 days or more require action — corrective action. If you are not sure where to start taking action, consider breaking your problem metric into its components to isolate the underlying causes.
Business Metrics Start with Data
“I often say that when you can measure what you are speaking about, and express it in numbers, you know something about it; but when you cannot express it in numbers, your knowledge is of a meager and unsatisfactory kind; it may be the beginning of knowledge, but you have scarcely, in your thoughts, advanced to the stage of science, whatever the matter may be.” — William Thomson, Lord Kelvin
To really understand your business you have to collect data about your business and then transform that data into meaningful information. Data itself is not information. Finding trends, patterns, or grouping the data is how you produce information. Afterall, business metrics start with data.

On Time Delivery Process Flow
On Time Delivery (OTD) Processes
Let’s say you have a problem with On Time Delivery (OTD), which is very common in any business. This means you are having trouble getting product to your customer as requested. You can measure OTD as the percentage of orders that ship on time. If your OTD goal is 99% and your actual OTD is 82% then you are failing to ship 17% of your orders on time. But the 82% number does not explain a lot because there are five different elements that each can cause some of the delay: suppliers, purchasing, warehouse, manufacturing, and shipping.
You need to measure what the OTD performance is for each element and combine them together to understand where the 82% is coming from. If each element ranges from 91% to 99% then every area is doing pretty good, right? So where do you focus?
- 91% Supplier OTD
- 96% Purchasing OTD
- 97% Warehouse OTD
- 98% Manufacturing OTD
- 99% Shipping OTD
Rolled Yield
Rolled Yield = 91% x 96% x 97% x 98% x 99%
= 82.2%
It is not an addition problem. The probability of success of each element is multiplied with each other to get a probable outcome for the chain. This means that you are only as strong as your weakest link. Another way to look at it is to realize that the downstream process steps inherit the waste from the previous process steps.
When we roll the yield together it now becomes pretty obvious where the 82% comes from and where we need to focus. Suppliers are on time 91% of the time. If we work on supplier OTD and get it up to 99% then the rolled yield rises to 89%, which is 40% of the problem solved.
In fact, even if every element was on time 99% of the time, the rolled yield would still only be 95%, which means that the only way to get 100% OTD is if every element is at 100%. Zero defects is the only solution to 100% OTD. You start with the biggest OTD problem–suppliers, and then continuously improve the others over time. This is what business process management is all about.
Reducing Variation Objectives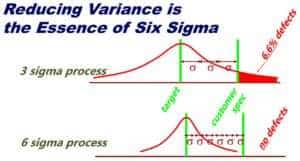
Reducing variation — our primary objective — is about eliminating process waste. One often misunderstood example of process waste is inventory. Inventory provides a buffer against all the various unknowns you run into in your business.
Inventory is composed of three parts:
raw materials + work-in-process + finished goods
Each one represents an inefficiency:
- Raw materials inventory represent the inefficiency of your suppliers and purchasing cycle. For example, the longer it takes your supplier to deliver your raw materials, the more safety stock (buffer) you need to manufacture your own products. Raw material inventory is your buffer from supply chain variability.
- Work-in-process (WIP) inventory represents the inefficiency of your manufacturing cycle. For example, the longer it takes to make a customer’s order (typically due to large batch sizes), the more work-in-process (buffer) you need to keep the line moving. WIP is you buffer from your own manufacturing variability.
- Finished goods inventory represent the inefficiency of your customer demand, sales forecasting, or order-to-delivery cycle. For example, the longer it takes to restock or deliver a customer’s order (lead time), the more finished goods inventory (buffer) you need to get the order. Finished goods inventory is your buffer to customer order variability.
When combined, you get the sum total of your suppliers, customers, and your own manufacturing inefficiencies. The inventory metric here is inventory turns.
Let’s say your company is at 7 turns and your competition is at 15 turns. Then the competition has a significant competitive advantage over you. Higher turns translates into more efficient use of cash because less money is tied up in inventory. So, to create a competitive advantage for your own company, you will need to be twice as good. Therefore your target for inventory turns should be 30 to be twice as good. So you have to improve your turns from 7 to 30.
Diagnosing Business Situation Outcomes
Improving business performance is about diagnosing business situations that contribute to the problem under study. Now that you have the Inventory Turns metric identified, you are ready to review the business situations that are influenced by the metric. There are a number of ways we can reduce inventory.
Let’s start with the most obvious:
Manufacturing Process
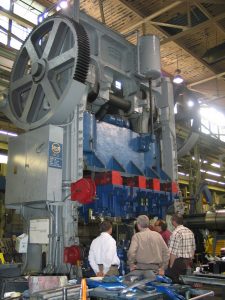
Manufacturing Policies Procedures documents.
-
- Reducing batch size drives inventory down.
- Setting cycle time to lead time drives inventory down.
- Reducing scrap drives inventory and costs down.
- Decreasing cycle time drives inventory down.
Purchasing Process
-
- Reducing purchase lot size and increasing frequency drives inventory down.
- Setting purchasing cycle time to supplier lead time drives inventory down.
- Reducing purchasing errors drives inventory and costs down.
- Decreasing purchasing cycle time drives inventory down.
Sales Process
-
- Increasing order frequency drives inventory down.
- Setting sales cycle time to customer lead time drives inventory down.
- Reducing sales forecasting errors drives inventory and costs down.
- Decreasing lead time drives inventory down.
In each of these examples you will notice a familiar pattern. Each one is a cycle or process and each one is contributing to the inventory problem in the same way. Therefore, the solutions look very similar. You just have to identify the source of the inventory problem and eliminate it.
Optimum Inventory Turns
If we want to find capital using inventory procedures, we will have to do all of these to reach an optimum inventory turns ratio. If we can turn inventory every day and there are 250 business days in a year then the highest inventory turns we could possibly achieve is around 250 (once a day). So an upper limit to inventory turns might be 250. But in reality, a more practical goal might be 52 turns or once a week.
Most companies think 12 turns (once a month) is pretty good. But 12 is a far cry from 250. If you really want to have a competitive advantage in an industry then a target of 24 (twice a month), twice as good as the average, would be a good goal, but really you should be thinking in terms of 52 (once a week) turns to be great! Why settle for good when you can be great.
Are Your Corrective Actions Impacting Your Trends?
Your corrective action should be improving your results; otherwise you are not working on the right things — the root causes. Of course you may be faced with an intractable problem at some point in time. So if you are unable to change the trend with a corrective action, then is it a metric you should even track? If it is then you need to continue to break the process down into smaller elements and measure each one until you find a point you can leverage. That is your root cause.
Are Your Business Metrics Strategic?
Where did your business metrics come from in the first place? Your performance metrics should be linked to your organizational strategy, your quality objectives, and your mission/vision/policy statements. This is how your policy deployment process is supposed to work. Unfortunately, it doesn’t always happen this way.
Instead you may end up with too many metrics or not enough of the right metrics. To keep track of your operational metrics, consider using a business dashboard or scorecard. Business dashboards, scorecards, or flash reports may change over time. A typical scoreboard will be revised six or seven times before it is contains the right, meaningful financial performance objective, measurable Key Performance Indicators (KPI) or metrics.
Business Dashboards
Too many metrics on your dashboard causes a lot of confusion. Employees can’t focus on too many things at once. When you have too many KPIs then you have to ask yourself “are the metrics providing meaningful data?” You may be burying the leading indicators for measuring organizational success with many other business metrics that are just noise to the process.
When this happens you have to get back to first principles. What is the mission/vision/policy you are trying to realize? Consider breaking down the metrics to the ones that matter. If you have a very lean, stable manufacturing process that is balanced with even flow, then you should be at 100% OTD already. This is easy, just measure supplier performance because the rest drops out.
Business Scorecards
Business dashboards, balanced scorecards, or daily flash reports should change over time as a result of effective corrective actions that improve your metrics. Plan on revising your business performance scoreboard six or seven times before it is contains meaningful and measurable Key Performance Indicators or metrics. If your management dashboard is not evolving over time, then don’t be afraid to change the scorecard you are using. If you are serious about your mission, vision, and policies then remember, what gets measured gets managed.
Operational Metrics are Used to Run a Business
There are many business indicators used to derive meaningful financial performance targets, measurable KPIs, or business metrics. To truly understand your business, you must first collect data about it and then translate it into relevant knowledge. Data is not the same as information. Information is created through identifying trends, patterns, and grouping data. After all, business measurements are built on data. What do your business analytics reveal about your company?
Download free policies and procedures in MS Word as a starting point to developing your well-defined processes documentation.


Leave a Reply