What Operational Metrics are Used to Run a Business?

Operational metrics show whether the processes that run your business are producing the results you expect. Useful business metrics connect a strategic objective to a measurable process outcome, such as on-time delivery, rolled yield, inventory turns, cycle time, or corrective-action effectiveness.
The goal is not to track every available number. Start with the result that matters, break it into the process steps that create it, assign an owner, and review the trend often enough to act. This article explains how to diagnose a weak metric with a worked On Time Delivery example and an operational scorecard you can adapt.
What Do Your Business Metrics Say About Your Business?
A business metric is a quantifiable measure used to assess the performance of a business function. A metric becomes useful when it helps someone make a decision. A rising trend may confirm that a corrective action is working, while a falling trend may signal a process problem that needs investigation.
Tracking operational metrics is an excellent place to start when you want to enhance operations and understand what is coming from the process. Finding trends and patterns creates information, but good or bad trends that you cannot explain require investigation. Trends can change over time, so do not be afraid to adjust a dashboard or scorecard when the evidence changes.
Do not raise or lower a target simply because a chart moved for an arbitrary number of days. Choose a review window that matches the process cycle and produces enough observations to distinguish a real pattern from normal variation. The National Institute of Standards and Technology notes that the cycle used to measure a trend should relate to the cycle time of the process being measured.
Business Metrics Start with Data
Business metrics start with data, but data itself is not information. To understand your business, collect consistent data and transform it into meaningful information by identifying trends, patterns, comparisons, and relationships.
Measurement is valuable because it makes a process observable. The important question is what the number helps you decide. If a measure does not support a decision, resource allocation, customer requirement, or corrective action, it may not belong on the management dashboard.
On Time Delivery (OTD) Processes
Consider a hypothetical On Time Delivery (OTD) problem for a business that fulfills physical orders. In this example, OTD is the percentage of orders shipped by the promised ship date. If the goal is 99% and actual OTD is 82%, the overall number identifies a gap, but it does not reveal the cause.
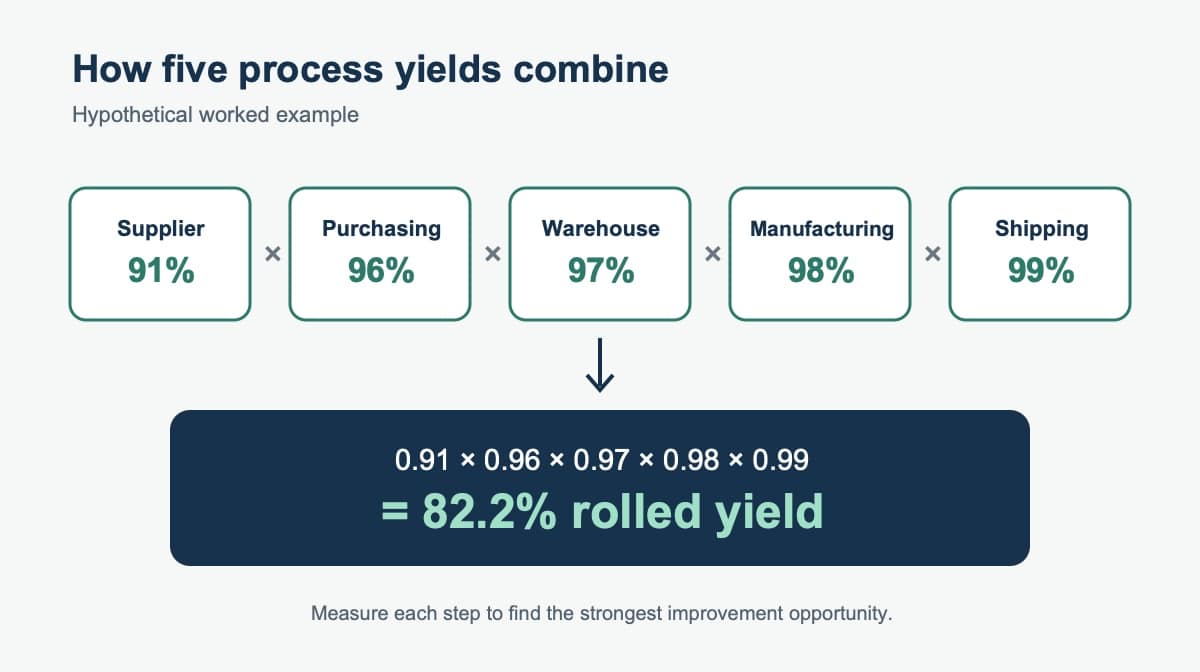
The order passes through five serial process elements: suppliers, purchasing, warehouse, manufacturing, and shipping. Measure the OTD performance of each element to see how the chain produces the final result:
- 91% Supplier OTD
- 96% Purchasing OTD
- 97% Warehouse OTD
- 98% Manufacturing OTD
- 99% Shipping OTD
Rolled Yield
Rolled Yield = 91% × 96% × 97% × 98% × 99% = 82.2%
This is not an addition problem. For the hypothetical serial process, the probability of success at each element is multiplied to estimate the outcome for the chain. The American Society for Quality explains that rolled throughput yield and total process yield are computed as the product of the yield at each process step.
The downstream process steps inherit the loss from previous steps. Supplier OTD is the largest improvement opportunity in this example. If supplier OTD rises from 91% to 99% while the other yields stay constant, modeled rolled yield rises from 82.2% to about 89.4%. That closes roughly 40% of the original gap to 100%, but it does not guarantee the same result in a different process. Use actual process data to test the effect.
Continue improving the remaining elements over time. That process-level diagnosis is a practical part of business process management.
Reducing Variation Objectives
Reducing variation means making a process more predictable while protecting the outcome the customer needs. Inventory illustrates the tradeoff. From a lean-management perspective, excess inventory can hide delays, large batches, forecast errors, and other process waste. Inventory can also be a deliberate buffer against supplier variability, demand changes, and service risk.
Inventory is composed of three parts:
- Raw materials inventory reflects purchasing decisions, supplier lead times, and the buffer needed against supply variability.
- Work-in-process (WIP) inventory reflects the manufacturing cycle, batch size, queue time, and the buffer needed to keep production moving.
- Finished goods inventory reflects customer demand, sales forecasting, replenishment time, and the buffer needed to meet orders.
When combined, these categories reveal how suppliers, customers, and internal processes affect working capital and service. The inventory metric used here is inventory turns.
Inventory Turns = Cost of Goods Sold ÷ Average Inventory
OpenStax uses this formula and explains that the ratio measures how many times inventory rotates through the sales cycle during a period. A higher ratio may indicate more efficient use of inventory, but there is no universal target. Appropriate inventory turns depend on industry, product life, perishability, lead times, service levels, demand variability, and the business model.
Diagnosing Business Situation Outcomes
Improving business performance requires diagnosing the business situations that contribute to the problem under study. Once you identify Inventory Turns as a relevant metric, review the processes that influence it.
Manufacturing Process
- Reducing batch size can reduce work-in-process inventory.
- Aligning cycle time with lead-time requirements can reduce queues.
- Reducing scrap can lower inventory consumption and cost.
- Decreasing cycle time can reduce the inventory needed to keep work moving.
Purchasing Process
- Reducing purchase lot size and increasing order frequency can lower raw-material inventory, subject to ordering cost and supplier constraints.
- Aligning purchasing cycle time with supplier lead time can reduce unnecessary buffers.
- Reducing purchasing errors can lower inventory and rework costs.
- Shortening purchasing cycle time can improve replenishment responsiveness.
Sales Process
- Increasing order frequency can reduce finished-goods inventory when demand and operations support it.
- Aligning sales cycle time with customer lead-time expectations can improve planning.
- Reducing sales forecasting errors can lower inventory and service costs.
- Decreasing lead time can reduce the buffer needed to fulfill orders.
Each example describes a cycle or process that contributes to the inventory result. Identify the actual source of the problem, evaluate the service and cost tradeoffs, and choose a corrective action that addresses the root cause.
Optimum Inventory Turns
If you want to find capital using inventory procedures, do not double a competitor’s ratio or adopt a generic benchmark without context. Compare your current turns with your own trend, relevant industry data, service performance, stockouts, obsolescence, gross margin, and cash needs. Then set a target that improves working-capital efficiency without undermining customer service or production continuity.
Are Your Corrective Actions Impacting Your Trends?
A corrective action should be improving your results. If the trend does not change, first confirm that the review period is long enough for the process to respond. Then check whether the action addressed the root cause, whether the measure is accurate, and whether another process step is limiting the outcome.
If the metric remains strategically important, break the process into smaller elements and measure each one until you find a point you can influence. The OTD example follows this method by turning one overall outcome into five process-level measures.
If you are not sure where to focus, consider breaking the problem metric into its components. Different elements can cause the same delay. An effective corrective action targets the biggest source you can leverage, tests the result, and then continues to improve the other contributing steps.
Are Your Business Metrics Strategic?
Where did your business metrics come from? Your performance metrics should connect to organizational strategy, quality objectives, customer requirements, and mission, vision, or policy statements. This is how a policy deployment process links direction to daily operations.
NIST performance-measurement guidance recommends strategic and operational measures, leading and lagging indicators, accurate and timely data, and measures that provide a basis for decisions. It also warns that too many top-level measures can overwhelm decision-making while too few can hide important outcomes.
Business Dashboards
A business dashboard should make the vital measures easy to interpret. Too many KPIs can bury the leading indicators for measuring organizational success in noise. Too few can make one result, such as revenue, appear healthy while customer, workforce, quality, or process performance deteriorates.
Return to first principles: What mission, vision, policy, customer outcome, or strategic objective are you trying to realize? Which process produces that outcome? What leading indicator warns that the result may change, and what lagging indicator confirms the final result?
Business Scorecards
Business dashboards, balanced scorecards, and daily flash reports should evolve as strategy, risks, and corrective actions change. Revise the business performance scoreboard when a measure no longer informs a decision or when a new risk requires attention. Preserve continuity long enough to understand trends, but do not keep a metric only because it has always been reported.
Worked Metric-to-Root-Cause Scorecard
The following hypothetical scorecard turns an overall OTD result into process-level ownership and action. Replace the sample values with verified data from your own process.
| Process step | Current yield | Loss | Owner | Corrective action | Review cadence |
|---|---|---|---|---|---|
| Supplier | 91% | 9% | Purchasing manager | Segment late deliveries by supplier and cause | Weekly |
| Purchasing | 96% | 4% | Procurement lead | Review approval and order-release delays | Weekly |
| Warehouse | 97% | 3% | Warehouse manager | Analyze pick, pack, and staging exceptions | Daily |
| Manufacturing | 98% | 2% | Operations manager | Track schedule misses, scrap, and queue time | Daily |
| Shipping | 99% | 1% | Logistics lead | Review carrier cutoff and dispatch exceptions | Daily |
Operational Metrics are Used to Run a Business
Operational metrics are used to run a business by connecting strategic objectives to the processes that produce customer, quality, financial, and workforce results. To understand your business, collect reliable data, translate it into relevant information, and use the information to decide where to act.
Start with a small set of meaningful KPIs, then break a weak result into its process components. Assign an owner, document the corrective action, and choose a review cadence that matches the process. What do your business metrics say about your business? They should show whether the process is working, where performance is being lost, and what decision comes next.
Download free policies and procedures in Microsoft Word as a starting point for developing well-defined process documentation.
Frequently Asked Questions
What are operational metrics?
Operational metrics measure how well the processes that run a business are performing. Examples include on-time delivery, rolled yield, inventory turns, cycle time, error rate, and corrective-action effectiveness.
How do you choose useful business metrics?
Begin with a strategic objective or customer outcome, identify the process that produces it, and select measures that support a decision. Include leading indicators that warn of change and lagging indicators that confirm results.
What is rolled yield?
Rolled yield estimates the combined yield of a multi-step process by multiplying the yield at each serial step. It helps reveal how small losses across several steps can produce a larger gap in the final result.
What is the formula for inventory turns?
Inventory turns equal cost of goods sold divided by average inventory for the period. Interpret the ratio with industry, lead-time, service-level, product-life, and business-model context rather than using one universal target.
How often should a business review its metrics?
The review cadence should match the process cycle, decision speed, and amount of data available. A daily process may need daily or weekly review, while a slower process may require a monthly or quarterly view to identify a meaningful trend.