control charts
What is Meant by Variation in Processes?
December 16, 2020 -
Improve Business Processes
Determining the cause of process variability is the key to understanding how to reduce it.
Read more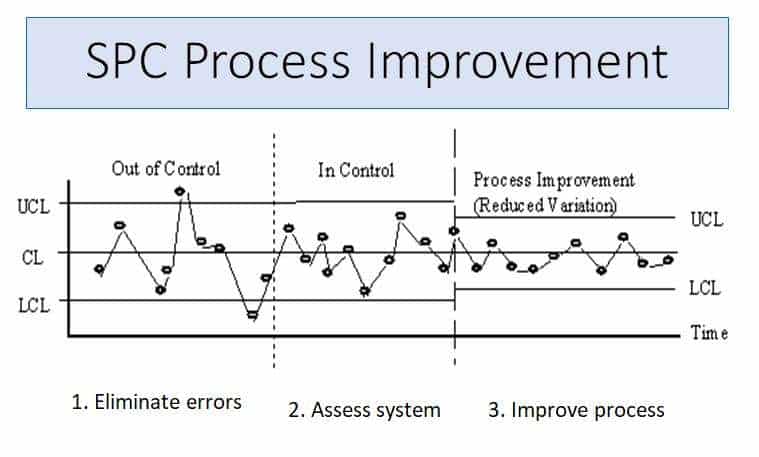
How to Use Control Charts for Continuous Improvement
April 29, 2020 -
Improve Business Processes
A control chart is graphically plotted SPC information. What are the most typical among control charts and how can they help with continuous improvements?
Read more
Best Manual Deals
Business Manuals
-
 Accounting Policies and Procedures Manual | ABR31M
$ 495.00
Accounting Policies and Procedures Manual | ABR31M
$ 495.00
-
 IT Policies and Procedures Template Manual | ABR34M Information Security Policy Manual
$ 495.00
IT Policies and Procedures Template Manual | ABR34M Information Security Policy Manual
$ 495.00
-
 HR Policies and Procedures | ABR41M Employees Policy Examples
$ 495.00
HR Policies and Procedures | ABR41M Employees Policy Examples
$ 495.00
-
 Sales Marketing Policies and Procedures Manual | ABR44M
$ 495.00
Sales Marketing Policies and Procedures Manual | ABR44M
$ 495.00
-
 ISO 9001 2015 Procedures | ABR211M
$ 495.00
ISO 9001 2015 Procedures | ABR211M
$ 495.00
-
 Finance Policies Procedures Manual | ABR42M
$ 495.00
Finance Policies Procedures Manual | ABR42M
$ 495.00
-
 Security Policies and Procedures Manual | ABR32M
$ 395.00
Security Policies and Procedures Manual | ABR32M
$ 395.00
-
 Disaster Recovery Planning Manual | ABR33M
$ 395.00
Disaster Recovery Planning Manual | ABR33M
$ 395.00
-
 AS9100 Quality Procedures Manual Rev D | ABR217M Aerospace QMS
$ 395.00
AS9100 Quality Procedures Manual Rev D | ABR217M Aerospace QMS
$ 395.00
-
 ISO 22000 Food Safety Procedures Manual | ABR213M
$ 197.00
ISO 22000 Food Safety Procedures Manual | ABR213M
$ 197.00
Get to Know Us
About
Bizmanualz
Our
Customers
Our
Contributors
Featured
Products
Business
Manual Products
FREE
Policies and Procedures
Privacy
Policy
FAQs
Risk
Free Guarantee
Process
Improvement
Contact
Us
Top Business Blog Posts
What
is a Procedure?
What
are Policies and Procedures SOPs?
What
is the Purpose of a Procedure Manual?
What
is the Difference Between Policies and Procedures?
How
to Create a Standard Operating Procedure
What
are the Top 10 Core Business Processes?
Are
Procedures the Same as Work Instructions?
What
Business Policies Does Every Company Need?
How
to Start Writing Policies and Procedures
Business Procedures
Accounting
Manuals Template
Finance
Procedures
HR
Procedures
IT
Policies and Procedures Templates
Sales
Marketing Procedures
Quality
Assurance Policy Statement and Procedures
Medical
Office Procedures
Employee
Handbook Manual
Aerospace
Procedures
Food
Safety Procedures
Security
& Disaster Plans
Production
Procedures
Procedure
Writing Guide
Featured manuals
-
 9-Manual CEO Company Policies and Procedures Bundle | Save 45%
$ 2,495.00
9-Manual CEO Company Policies and Procedures Bundle | Save 45%
$ 2,495.00
-
ISO 22000 Food Safety Procedures Manual | ABR213M
$ 197.00
-
 ISO 22000 Seguridad de los Alimentos Procedimientos | ABR219M
$ 195.00
ISO 22000 Seguridad de los Alimentos Procedimientos | ABR219M
$ 195.00
-
 ISO 9001 Quality Manual | ABR211MPM
$ 49.99
ISO 9001 Quality Manual | ABR211MPM
$ 49.99
-
 How to Prevent Embezzlement Manual | ABR242DWD
$ 19.99
How to Prevent Embezzlement Manual | ABR242DWD
$ 19.99