
ISO22000 FSMS Variables Control Chart Template Word

The ISO22000 FSMS Variables Control Chart Template Word is a comprehensive tool designed to help businesses in the food industry maintain and improve their food safety management systems. This template is specifically tailored to meet the requirements of the ISO22000 standard, which is the international standard for food safety management systems.
The template includes a set of control charts that can be used to monitor and control critical variables in the food production process. These charts are designed to help businesses identify trends and patterns in their data, which can be used to make informed decisions about process improvements and corrective actions.
The ISO22000 FSMS Variables Control Chart Template Word is easy to use and can be customized to meet the specific needs of your business. The template includes detailed instructions on how to use the control charts, as well as examples of how to interpret the data. It also includes a set of pre-populated charts that can be used as a starting point for your own data.
By using the ISO22000 FSMS Variables Control Chart Template Word, businesses can ensure that they are meeting the requirements of the ISO22000 standard and maintaining a high level of food safety. This can help to reduce the risk of foodborne illness and protect the reputation of your business.
Overall, the ISO22000 FSMS Variables Control Chart Template Word is an essential tool for any business in the food industry that is serious about maintaining and improving their food safety management system. With its easy-to-use interface and comprehensive set of control charts, this template is sure to help your business achieve its food safety goals.
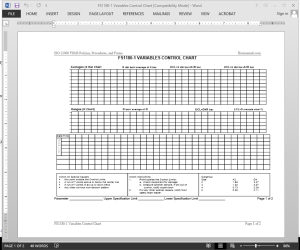
FSMS Variables Control Chart Template
FS1180-1 VARIABLES CONTROL CHART is one type of control chart suitable for recording and charting process performance data. Other types of charts may be used, as appropriate. The FSMS Variables Control Chart Template covers averages, ranges, date/time, readings, and more. The Food Safety Team Leader should analyze the data using appropriate statistical techniques.
To perform adequate and informative analyses, the Food Safety Team Leader should be adequately trained in the use of statistical analysis tools and techniques. Ongoing problems identified with statistical tools, such as the FSMS Variables Control Chart Template, should be subject to analysis, to discover root causes of the problems. Identifying and correcting root causes are central activities in continual improvement. Managers should review data analyses from the Food Safety Team Leader during management review meetings.
The purpose of this phase of the management review process is to analyze the variability of the process and product, using statistical indicators to identify opportunities to reduce or eliminate food safety hazards. After implementation and the collection of statistically significant data, an analysis of the data using techniques such as ANOVA (Analysis of Variance) will be conducted. This analysis will establish the magnitude and direction of the system response to the change.
 FSMS Variables Control Chart Template Details
Pages: 02
Words: 167
Format: Microsoft Word 2013 (.docx)
Language: English
Manual: ISO 22000
Procedure: FSMS Continuous Improvement Procedure FDS1180
Type: Chart


Reviews
There are no reviews yet.