What is the Goal of Value Stream Map Analysis?
You start with a first pass assessment to begin to understand your metrics, flows, and constraints to flow. The critical document to the first pass assessment was producing a rough Value Stream Map to document what you saw in order to communicate it to others. Now, we are going to use it in the second pass and final assessment to finish your value stream map analysis, to see the flow, and reduce the barriers to flow.
The Goal of Value Stream Map Analysis
It is now time for a second pass assessment. The analysis process is like peeling away the layers of an onion. We want to uncover each layer one at a time so we don’t miss the barriers to flow. Go too fast and we may not understand what we are looking at and not notice the flow. I like to use the concept of continual improvement over delayed perfection. We need to keep things moving and not get caught up in analysis paralysis. This is also called “Learning to See”.
The important thing is to work at the speed of the employees and not of the lean expert. The employees need to experience the change and they need to want to change. All too often you might have a lean expert come in and want to turn the whole organization upside-down too fast. The result is a quiet or sometimes loud revolt and then things start to go back the way they were before – to status quo.
The deliverables in the second pass include:
- Adding detail to the Current State Value Stream Map
- Creating a Visual Space Analysis
- Drawing a Material Flow Analysis
- Producing a Future State Value Stream Map
- Ranking the Improvement Opportunities
Detailed Current State Value Stream Map
Lean VSM Value Stream Map
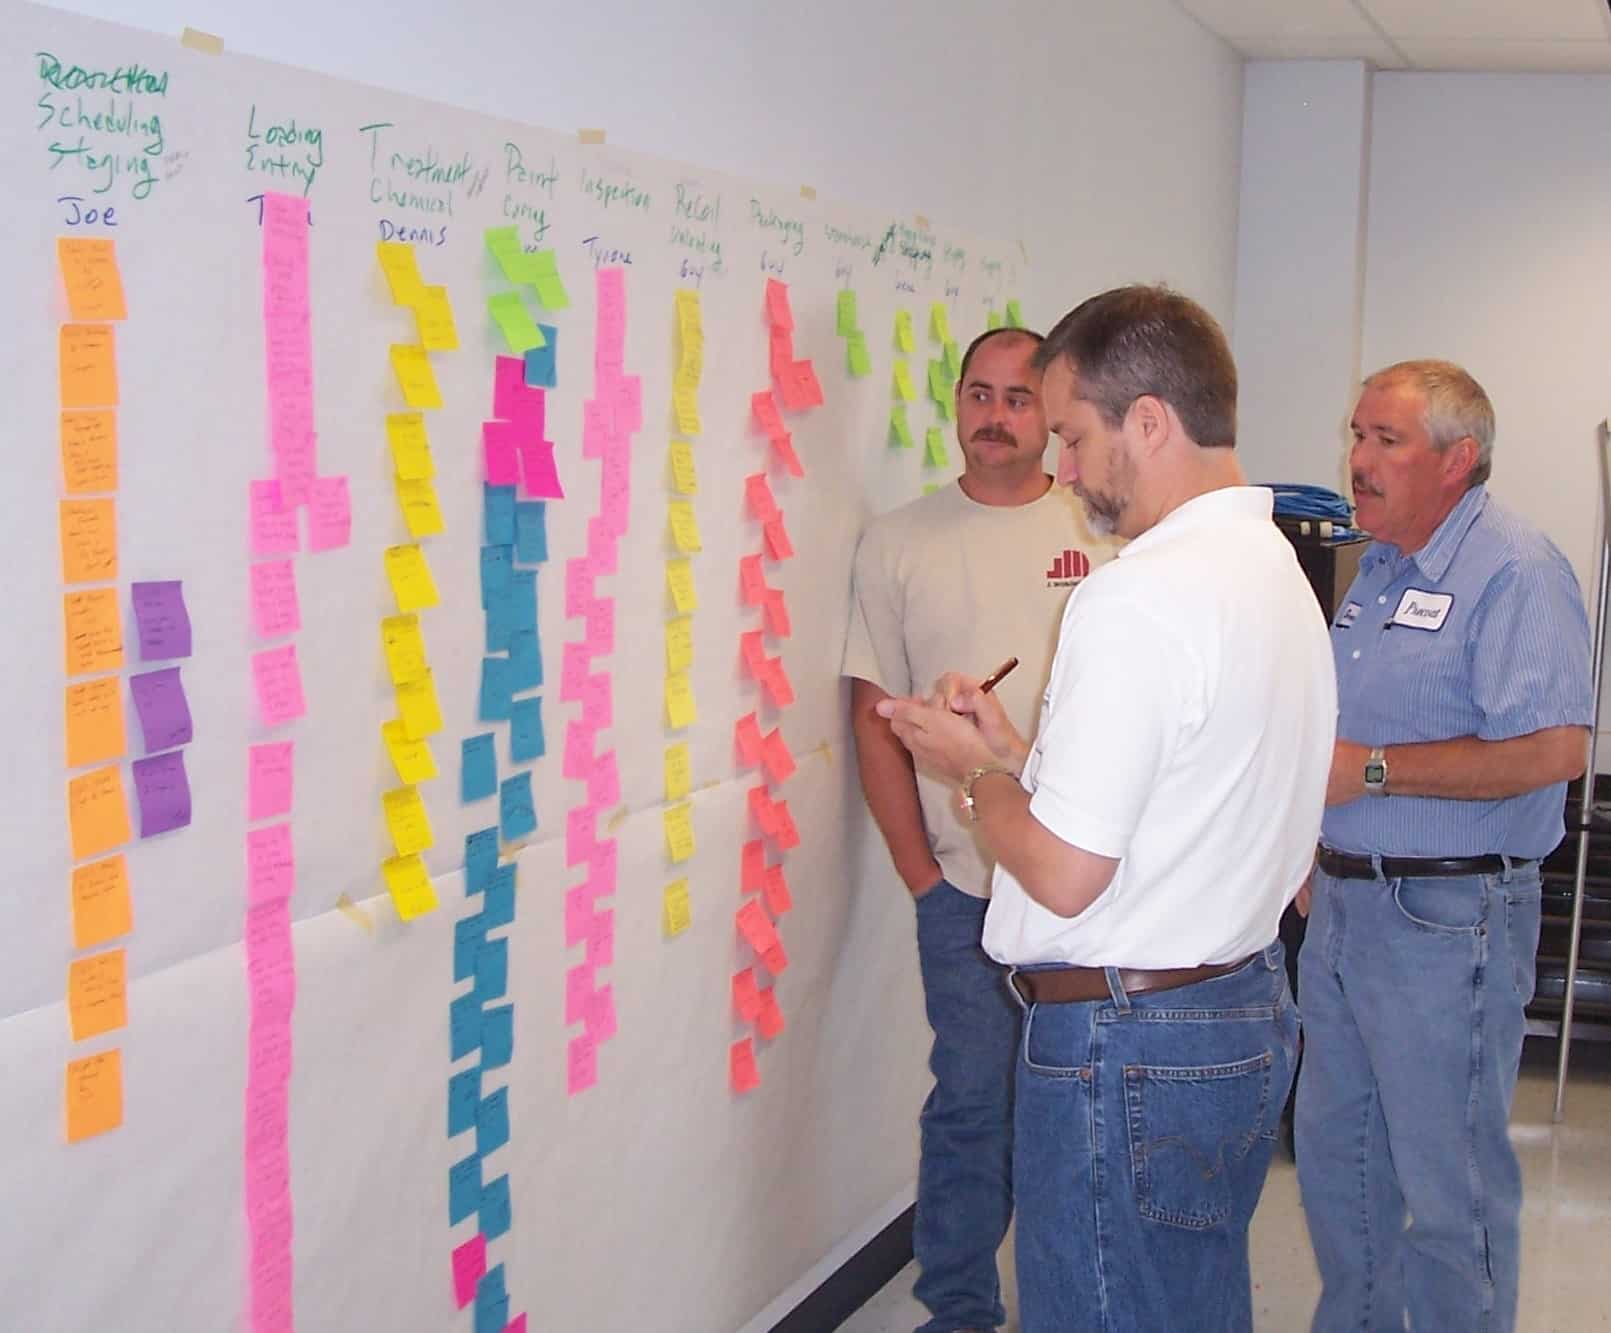
The first pass collected high level data used to make a value stream map, which is a form of process map. Now we want low level data. One technique that works real well is to gather representatives that do the work into a large room. Next, hand out medium sized post-it notes and ask each person to write down their tasks involved in processing an order into a shipped product.
Post all the notes on the wall in the process order. The steps can be broken down into sales, order entry, scheduling, purchasing, manufacturing, staging, shipping, and billing at a high level or you could focus on the manufacturing piece and break it into the manufacturing steps. It all depends on the scope of the improvement.
What you will end up with is a pretty, multi-colored description of your process. Now add process times to each note to indicate how long each step takes. And then discuss the value-added for each note.
Value Add vs. Non-Value Add
One of the most critical steps in the value stream map creation process is understanding your waste, which is also known as value-add and non-value add tasks. The definition of value-add we are using is based on whether or not the task transforms the product. Another way many look at it is whether the customer will pay for it or not, but this can be confusing.
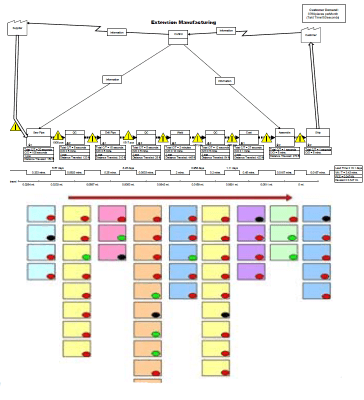
We want to evaluate each task to see if the task transforms the product. If it does we put a green dot on it to indicate value-add. If it does not then we use a red dot to indicate non-value add. And finally if we do not think it adds value but we have to do it anyway (i.e. for compliance reasons) then it gets a black dot.
When we are done we will have a lot of post-it notes on the wall, one for each task. Each note will have a task time and a colored dot indicating its value add. The wall should look something like this diagram. (You may use different colored post-it notes).
Asses Transformational Effectiveness
Now count the dots and total the times. In this example we have 51 tasks. 8 tasks add value, 37 are non-value-add and 6 steps are indicated as required non-value-add. In our 51 tasks only 16% are value-added tasks. I have seen operations with hundreds of tasks with less than 5% value added.
Transformational Effectiveness = Value Add Time / (Value Add Time + Non-Value Add Time)
What the participants will start to realize at this point is that their jobs consist mostly of non-value added activities. They may even start to think their job is not too secure either. This is all part of getting buy-in that change is needed and improvement opportunities do exist. But be careful, if we do not balance revenue growth with the improvement opportunity in front of us then according to the Iron Law of Layoffs, some people will lose their jobs.
We now have everyone’s attention and their thinking is beginning to change to lean thinking. They can now see the waste on the wall in front of them. Ask them if they think they can improve this process and most will say yes. If you ask them that earlier the answers would be mostly no or maybe.
Proposing New Solutions
In the second pass assessment, you capture a more detailed analysis of the metrics, flows, and constraints and document them in a Value Stream Map. Now, it’s time to finish the analysis so we can propose possible solutions. First, let’s look at the value stream map we created.
Value Stream Map
Visual Space Analysis
Did you ever stop to wonder whether the floor space you have is being used for value added work or not? Using a Visual Space Analysis you can determine how effective your plant layout is. Start by shading in or blocking out the space usage by category on a plant layout or CAD drawing.
Note categories and colors as follows:
- Raw Material – Orange
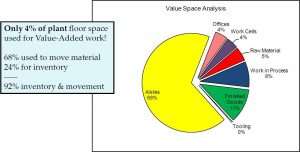
- Work in Process – Blue
- Finished Goods – Red
- Tooling – Brown
- Aisles – Yellow
- Offices – Purple
- Empty Space – White/Pink
- Value-added activity – Green (Includes 3-4 ft working space around cell)

Next calculate the square footage of space used by category and enter the results into a pie chart of space used. You now have a visual diagram of your space usage. You will probably find that most of your space is dedicated to non-value added materials or activities.
Material Flow Analysis
Next we can create a Material Flow Analysis, also known as a “spaghetti diagram“. Your material flow analysis is made by following your raw material through your plant until it becomes a finished good.
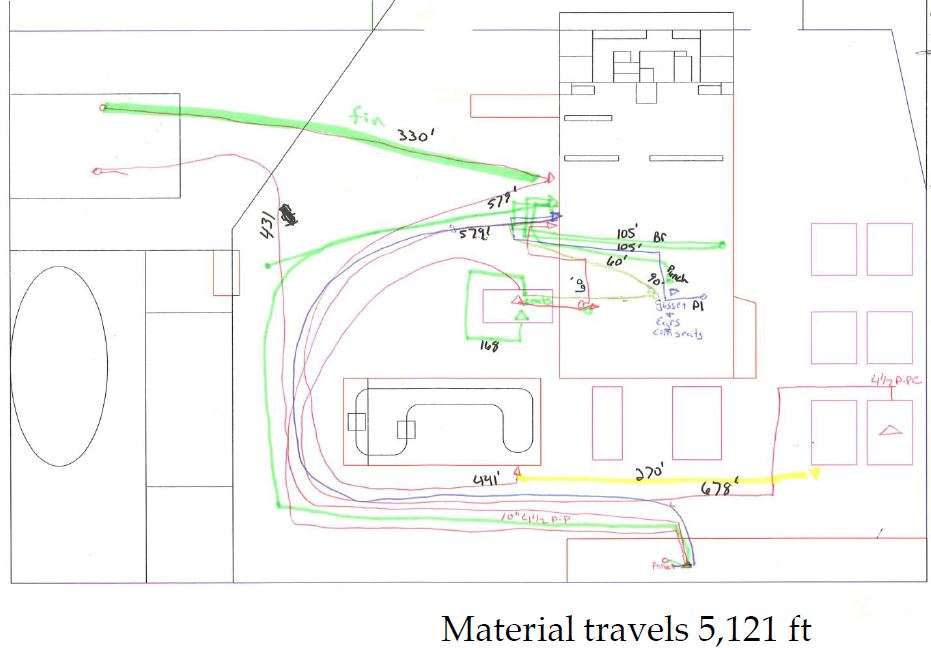
Use another copy of your CAD drawing to draw a line to highlight each material movement. Use a triangle at each point where material stops. Poorly organized plants with functional layouts will show a number of lines in a crazy pattern that begins to resemble spaghetti, hence the name spaghetti diagram. A plant organized by value streams will have neat flow lines with few stoppages to the flow.
 Future State Value Stream Map
In lean thinking we look at all process interfaces and customer touch points for waste production, introduction, or handling (automation or institutionalizing). Then work to reduce or eliminate all waste/non-value add activities.
Ranked Improvement Opportunities
The last step is to produce a list of your improvement opportunities. We start by comparing the future state with the current state. Improvements are identified with a starburst. In the example above, four opportunities were noted.
- Design kanban for raw materials
- Lot size set-up reduction
- Work cell redesign
- Design kanban for finished good
Estimate cost reduction potential and difficulty and then rank the opportunities. We are looking for an easy starting point to build confidence in lean. We need a fast solution. Long periods of analysis could kill the momentum we are trying to build. Typical improvement opportunities are included in the table below.
|
Improvement Opportunity
|
Expected Results
|
| Raw Material Reduction |
30%
|
| W.I.P. Reduction |
80%
|
| Finished Goods Reduction |
40%
|
| Material Flow Reduction |
50%
|
| Vendor Base Reduction |
50%
|
| Productivity Increase |
20%
|
| Improved QUality (scrap/rework) |
50%
|
| Set-up Reduction |
80%
|
The Goal of Value Stream Map Analysis
You will notice that as we implement lean the focus is not on the lean tools but instead we try to focus on our own thinking and what the customer needs and wants. We look for ways to build flexibility into the system to handle the variation in customer demand instead of forcing the customer to fit their demand into our system. Minimum order quantities, quantity price breaks or making the customer wait for delivery are signs of forcing customer demand into a your system.
Look for solutions that increase flexibility and create a more agile system. Focus the organization’s metrics on process capability measures. And change the thinking. Your thinking governs your performance. So, if you fail to change the thinking, you have failed to truly implement lean. The goal of value stream map analysis is to change your thinking, learn to see the flow, and reduce the barriers to flow to make your business run smoother, more effectively, and efficiently.


Leave a Reply