Do You Have a Business Performance Scoreboard?

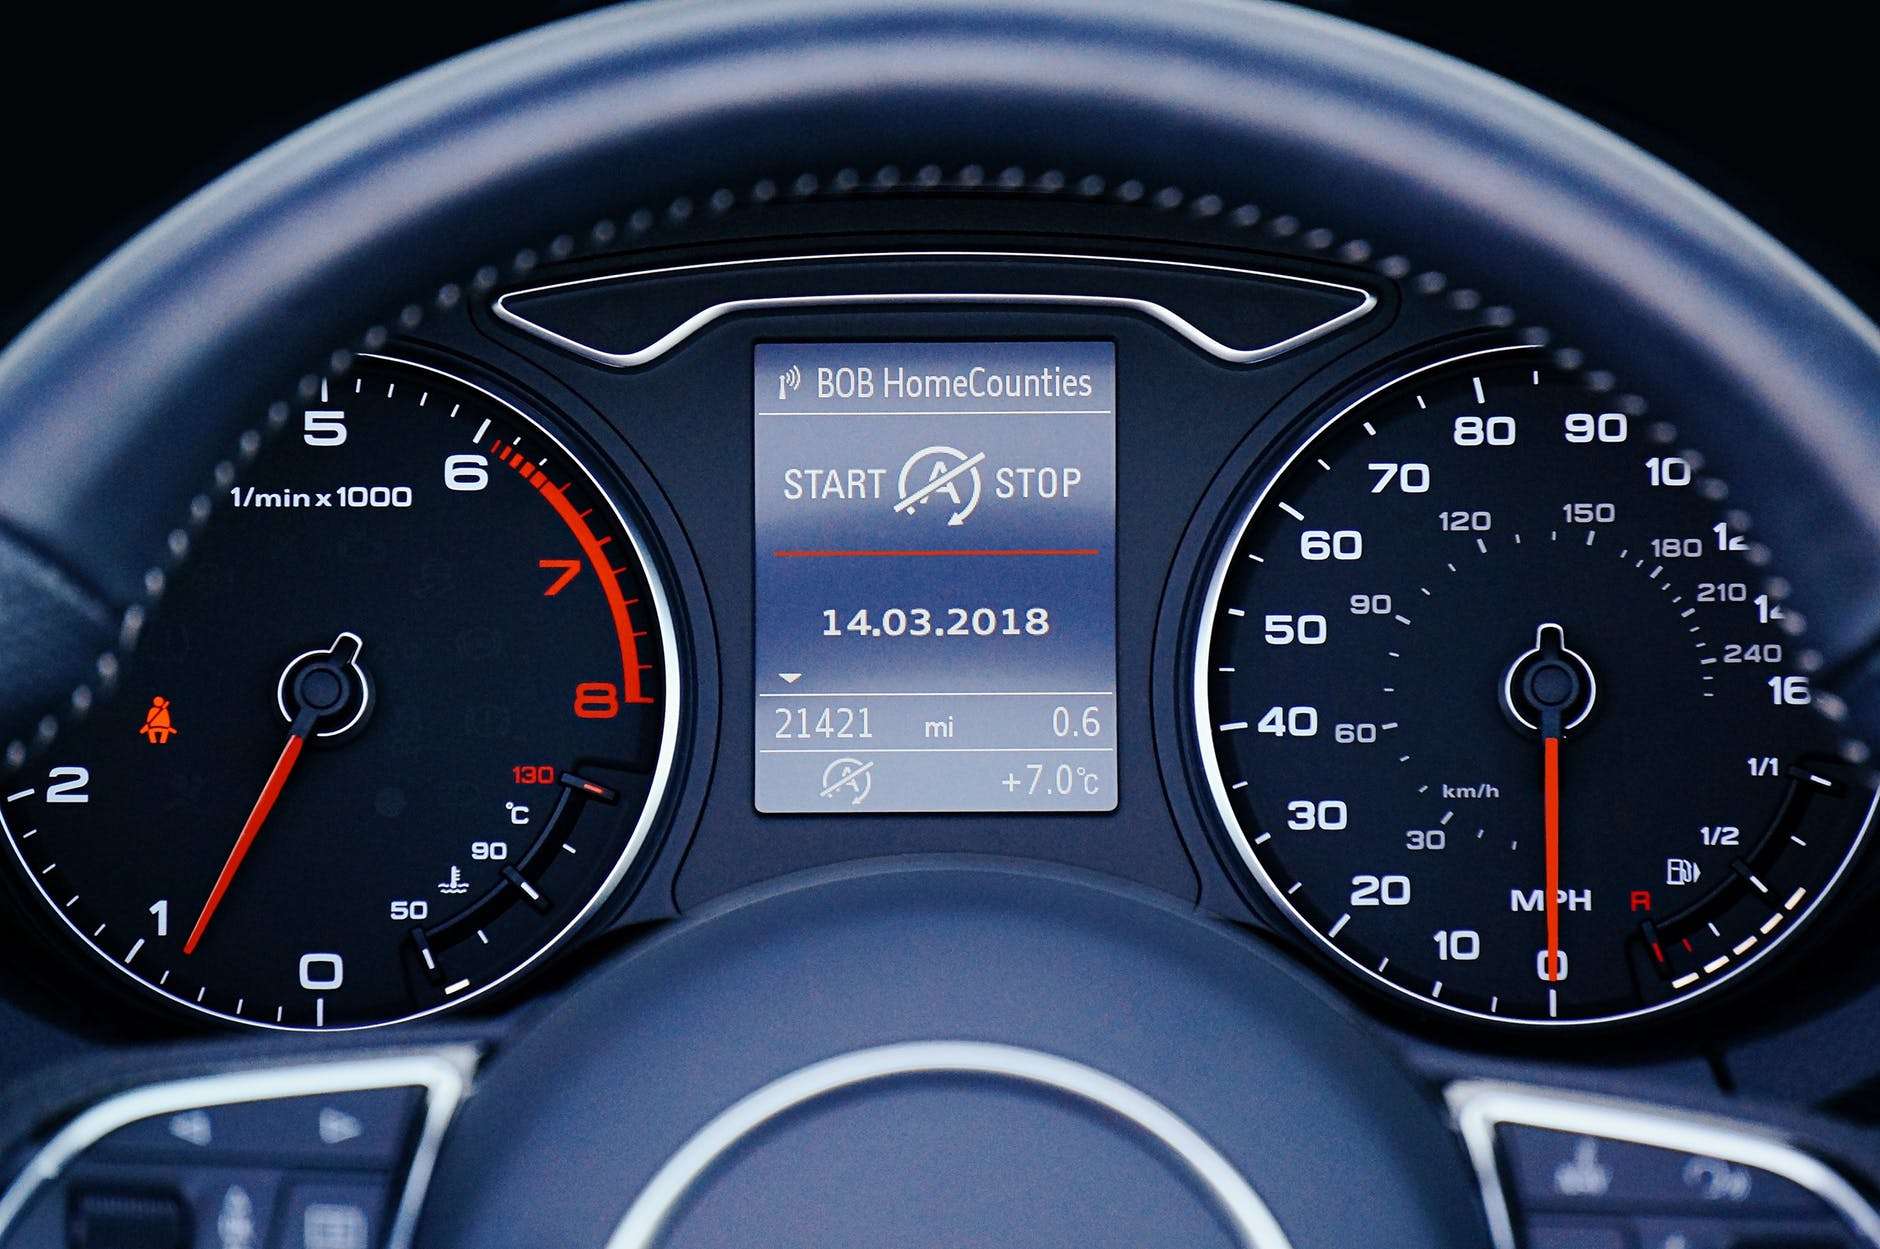
Airplane pilots pay attention to a number of things while flying a plane, as the plethora of dials, gauges, and displays on an airplane’s instrument cluster indicate. Some instruments require constant monitoring, some are checked occasionally, and still others may be checked only prior to takeoff or before landing. Still, they all have a role in helping the pilot safely operate the aircraft. I doubt if any of us want to fly with a pilot who doesn’t make effective use of the information that this complex set of instruments provides. Do you have a Business Performance Scoreboard?
A Business Scoreboard

The same idea applies to operating a business or a department. Sometimes managers get very focused on monitoring one thing in their business (i.e. on-time shipments), to the exclusion of everything else. In this scenario, they have as much a chance of success as myopic, single instrument pilots do of reaching their destination.
Successful managers, like good pilots, need to monitor various aspects of performance in order to make informed decisions and appropriate corrections. Do you have a Business Performance Scoreboard?
A Business Instrument Panel
Reorganizing a production area according to lean principles and creating an atmosphere of continual improvement through a kaizen program are two aspects of the improvement journey. Another important feature of such an improvement journey is the Bizmanualz Scoreboard.
Bizmanualz has divided its organizational efforts into five broad categories:
- Development
- Marketing/Technology
- Sales
- Fulfillment (Production, Delivery)
- Customer Satisfaction
The first step in creating a scoreboard is to recognize key objectives for each business segment or category, and set specific targets. The next step is to find or develop ways to measure performance in relation to these objectives. Then, the objectives and targets are listed clearly and specifically, and posted on the scoreboard. Data is gathered by collecting and processing performance measurements, and then it is typically formatted into an easy to read graph or chart and posted next to the objectives.
Monitor All the Key Business Activities
Let’s consider Development activities as an example. One aspect of Development is researching, writing, and reviewing new procedures for forthcoming Policy, Procedures & Forms manuals. An objective in Development is for the technical writing staff to complete 2 procedures every week. We have regular review meetings where procedures in process are reviewed by the technical writing staff and by subject matter experts.
For every review meeting there is an agenda, and as part of the meeting minutes we capture data about the status of procedures in process, and when a procedure is “closed” (work on it is complete until the final manual reviews). Using these meeting minutes as a way to capture data about procedures, it is easy to take the next step and chart the number of procedures closed each week and compare it against the stated objective.
When performance does not match objective goals, we try to understand why. Sometimes there are valid reasons for not meeting objective goals that fall into a “special case” category. For example, a review meeting was postponed, or a technical writer was on vacation. (These circumstances should be built into an overall project schedule.) Regularly missing goals, however, indicates an issue with the objectives themselves or with the process that needs to be addressed.
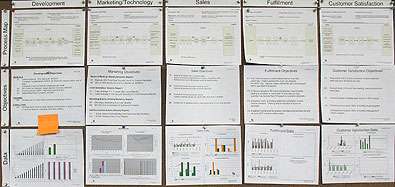
The Bizmanualz Scoreboard displays key segment processes, clearly stated objectives, and on-going performance metrics.
Creating the Business Performance Scoreboard
Key objectives and goals for each of the five business segments are posted on the “scoreboard.” (Be sure to look outside your business when setting objectives and goals: what are industry standard benchmarks? What is your best competitor doing?) Regular chart updates display current measurements relative to objectives are displayed on the business dashboard for the area. Now, at a glance, everyone can see how the company is performing in key aspects of each business area.
So, while on time shipping is important, we don’t focus solely on it or on any single facet of the business. To know and understand how the business is performing we watch all the indicators, some closer than others, just as a pilot watches all the indicators in the cockpit instrument panel.
The bottom line is, how can you improve if you don’t know how your doing compared to how you should be doing? How would baseball managers know whether to bunt, hit and run, or swing for the fences if they do not have access to the situational information a scoreboard provides?
How do pilots know if flying at 30,000 feet is good or bad if they do not know the altitude the plane is supposed to be flying at? Setting and communicating clear objectives, understanding situational information, and reflecting on measured performance is a key to success, as well as picking objectives for continual improvement.
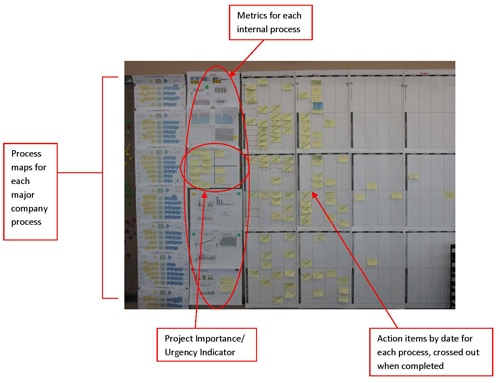
Lean Daily Management System Dashboard
Business Improvement – The Bizmanualz Mission
You will find this theme, of combining clear objectives and metrics with analysis and progression, applied throughout our business improvement products and services (manuals, training, and consulting). But it is also applied it in managing our own business processes.
After all, no matter how successful a business may be, there is always room for improvement. Businesses complacent with past success and a “we’re good enough” attitude are usually the ones caught unaware by innovative competitors or an industry paradigm shift.
A scoreboard is an improvement journey in itself. It must be constantly reviewed, enhanced, and updated. Admittedly, it is through unsuccessful ideas and implementations that real lessons about objectives and performance measurement are frequently learned. The dashboard is instrumental to understanding your journey, how far you have gone, and the velocity your business is operating at now.
Create a Scoreboard for Your Business
Occasional big improvements, constant small improvements, and the process of objective-measurement-review: these are just three of the mechanisms used on our improvement journey. Where is your improvement journey taking you? We hope your journey takes you onto continued growth, and delivering better and better products and services. If you are unsure then perhaps we can help. After all, that is why we are here and what our journey is all about.
To learn more about using process improvement programs for your organization, attend our upcoming classes.
1This anecdote is borrowed from The Balanced Scorecard by Kaplan and Norton


Leave a Reply