How Do You Use Data Visualization on a Website?
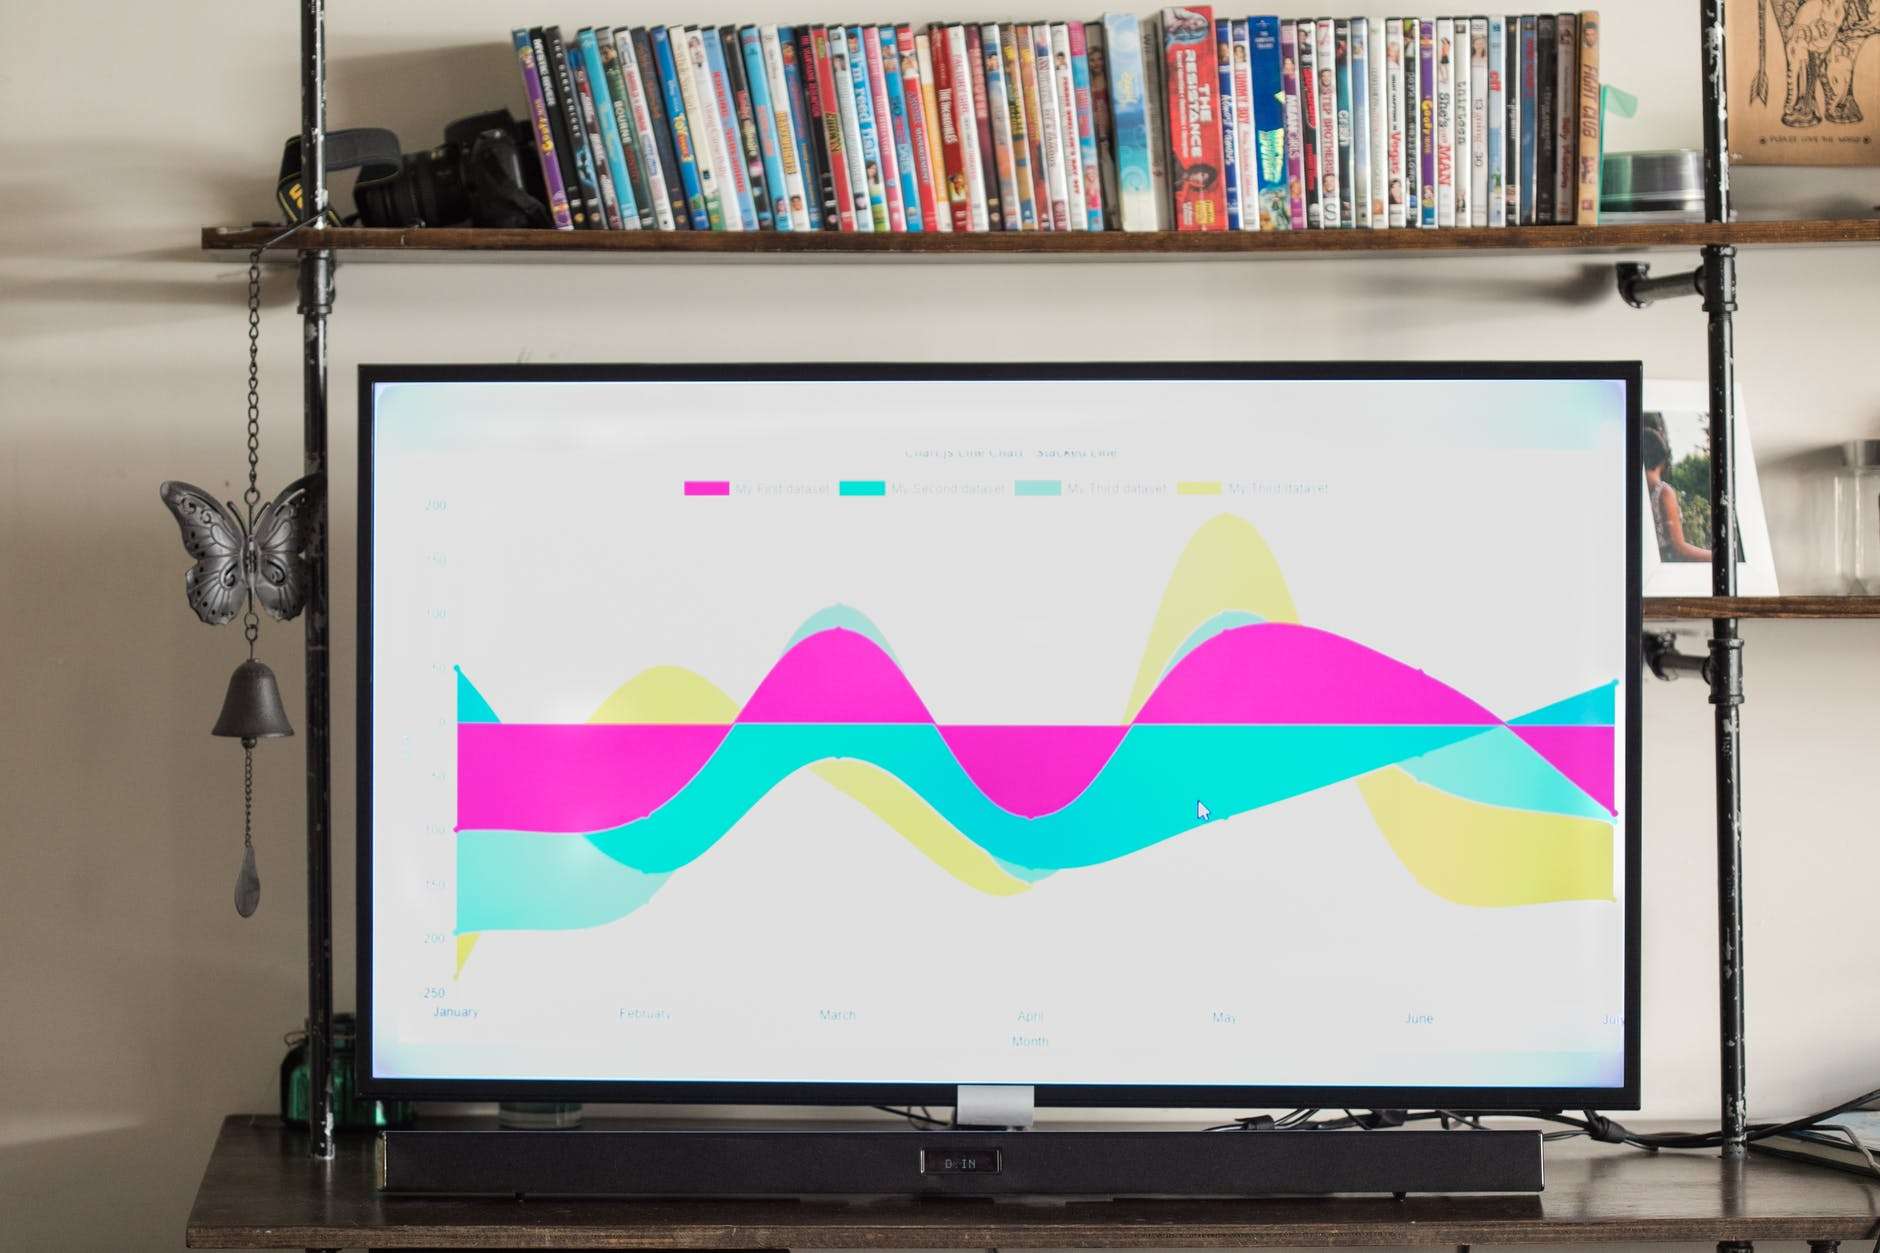
Data Visualization Tools
At initially, everyone is attempting to gather a large quantity of information on their visitors and website, but they quickly run into a problem. The problem is that there is a massive amount of data to comprehend. This is where data visualization software comes in. Using this method, you may review your extracted data in up to half the time and understand it as well.
With this in mind, you can begin designing your digital marketing strategy and you can much more quickly and successfully optimize your website. In addition, we can also say that using these tools will often give you much better results than relying solely on quantitative data. Not incidentally, they are even enjoyable to use. Sounds good right?
You’re surely wondering what exactly we’re talking about here, so let’s see what your options are:
- Heatmaps
- Replays
These two tools, both alone and in combination, can provide the ideal option for measuring your website. Don’t get us wrong: gathering quantitative data is crucial, but we believe that using heatmaps or replays may provide far more thorough findings. With this knowledge, you may increase the performance of your website.
Heatmap Analytics
Heatmaps are one of the most useful and popular data visualization techniques available. You can use it to determine the strengths and weaknesses of your website. You can also learn how your visitors interact with your website and which subpages they visit often. What is the mechanism behind it?
Consider it a thermal camera that measures temperature. This tool works on a similar principle. Warm colors denote popular regions of your website, whereas cooler hues denote less popular places. You’re probably wondering why this matters to you and why you should utilize it.
Consider this: if you know which sub-pages your visitors are more likely to visit, you may be able to advertise in a more targeted position that your visitors will notice. This will allow you to attract more customers to your goods or service.
You may also determine whether areas of your website are being overlooked. Heatmaps may help you make these spots more successful by displaying the most popular sections of your website. Use these components in less efficient regions. You may improve both your UX and the usability of your website in this manner. Heatmaps, as you can see, are great tools for measuring the efficacy of your website and visitor behavior. It might be an amazing choice for optimizing your website.
Session Replays
Replays are innovative data visualization techniques that are reshaping eCommerce. With the help of replays, you can check what your clients are doing on your website. They work similarly to heatmaps, but here you can literally see how your visitors behave on your website. Imagine replays as a screen recorder. You can see what users click on, what they open, and how they interact with your site.
It can be used to check the following elements, among other things:
- CTAs
- The cart
- Subpage usage
- Button usage
- Products
You can use this tool to figure out which CTAs are the most effective, which products are the most popular, and even how your customers use your website’s cart. You can completely optimize your website and boost your conversion rate with this data visualization tool.

Another advantage of replays is that you don’t have to worry with data analysis. The tool, like heatmaps, collects and quantifies data for you. This will allow you to generate a spreadsheet to track the performance of your website.
Use Data Visualization Tools to Boost Your Website Effectiveness
As you can see, data visualization plays a prominent role when you want to measure the performance of your website. In addition, you can use its benefits in the field of website optimization too, as you can increase the efficiency of your webshop based on the data collected. We propose combining replays and heatmaps because they are a great complement to one another. Also, keep in mind that quantitative data is still an important factor.


Leave a Reply