What is the Purpose of a Process Map?
You have probably heard of the term “Process Map” or a process flow chart (the terms are used interchangeably) to describe a process. But what is the purpose of a process map?
What Is a Process Map Used For?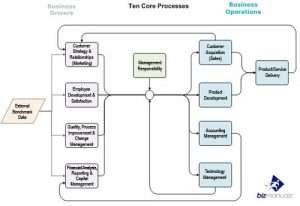
Are there different types of process maps? Are all process maps created equal? We’ll try to answer some of these questions by taking a look at seven different types of process maps and how they are used to describe a process. After all, the foundation of all businesses is a common set of core processes.
What’s the Definition of a Process?
A process is a structured set of activities that transform inputs into outputs.
We believe processes should be measurable with clear performance indicators. Processes are strategic assets of an organization that if managed well deliver a competitive advantage. And processes assist us in defining responsibilities, internal controls, and work standards for compliance, consistency, and performance.
Better Process Understanding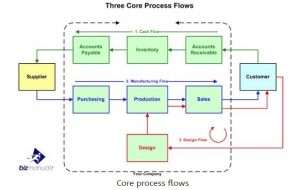
Process maps are used to develop a better understanding of a process, to generate ideas for process improvement or stimulate discussion, build stronger communication, and — of course — to document a process. Often times a process map will highlight problems and identify bottlenecks, duplication, delays, or gaps.
Process maps can help to clarify process boundaries, process ownership, process responsibilities, and effectiveness measures or process metrics. Process maps can be very effective at increasing process understanding during training.
Process Flows or Activities
A “process map” visually describes the flow of activities of a process. A process flow can be defined as the sequence and interactions of related process steps, activities or tasks that make up an individual process, from beginning to end.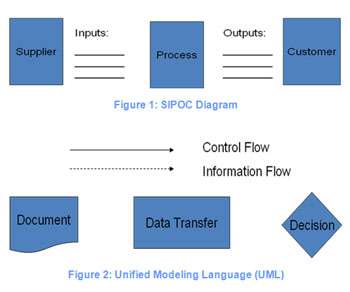
A process map is read from left to right or from top to bottom. We prefer to minimize “backflow” or arrows that go from right to left or bottom to top because it can greatly confuse the reader (more on this later).
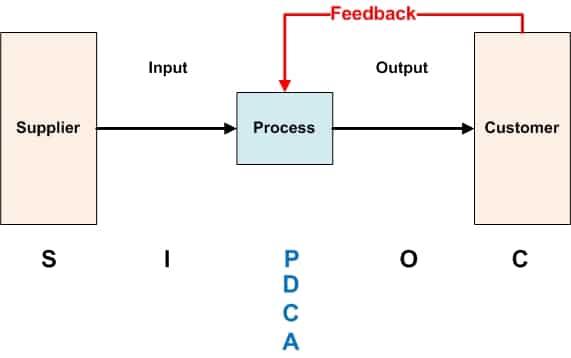
It helps if a process map identifies a Supplier providing Inputs to a Process, which produces Outputs for a Customer. We call this basic format a SIPOC (Supplier, Input, Process, Output, Customer) diagram (Figure 1).
There are many variations of this SIPOC theme but it does provide a useful framework for understanding the critical elements, sources, and outputs of a process. Standard symbols are used within a process map to describe key process elements.
These symbols come from the Unified Modeling Language or UML, which is an international standard for drawing process maps. There are many symbols that can be used. Figure 2 provides some common UML symbols.
Determining Processes
Process maps are not limited to a single department or function. For example, the quality assurance policy statement and procedures require the processes be determined. Using some type of process map of the organization’s quality processes is an easy way to determine your processes.
Process mapping should be the first step in designing a process or in documenting a procedure. Why? Because, to improve a process you must understand it and most of us understand a graphical picture better than a written procedure. The process map serves as an outline of the process allowing one to think through the process flow and outline each task, activity, and decision point.
SIPOC Process Map
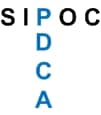
PDCA-SIPOC Overlap
Process maps come in many different forms but they all tend to use a SIPOC format and a standard UML for symbols. SIPOC stands for Supplier, Inputs, Process, Output, Customer.
The most common process map types include: High-Level Process Map, Process Flow Chart, Document Map, Cross Functional or Swim Lanes Process Map, Value Stream Map, Work Flow Diagram, and a Rendered Process Map.
Types of Process Maps
How important are process maps in developing policies and procedures? There are seven types of process maps, which include the 7 types of flow in accounting. We’ll discuss five types: High-Level, Low-Level, Cross Functional or “Swim Lanes” Maps, Document Maps and Activity Maps or Value Stream Maps.
A process map is a flow diagram of the primary processes within an organization. It very specifically shows you both who and what is involved in a process. Process maps visually describe the flow of activities of a process and are not limited to a single business department or function.
Process mapping is about communicating your process to others so that you achieve your management objectives. You can build stronger communication and understanding with process maps.
High-Level Process Map
One of the types of process maps is a High-Level Process Map. This describes all of the core processes within an organization. For example, ISO 9001 requires that the sequence and interaction of the Quality Management System processes are determined. One way to demonstrate that processes are “determined” is through a high-level process map.
Order to Cash Process
Figure 3 shows nine core processes that make up the Order-To-Cash Cycle, their sequence and interaction, thus fulfilling the basic ISO 9001 requirement. The color coded boxes show the three main process flows or cycles in your business:
- Red is your Order Cycle (Purchasing + Production < Sales);
- Blue is your Just-In-Time (JIT) Production Cycle (Shipping = Receiving + Production); and
- Green is your Cash Cycle (Inventory + A/R – Payables > 0); which taken together make up your Order to Cash Cycle.
Inputs/outputs are labeled, information flows are indicated with a dotted line, and the material flow is a solid line (black for inventory and red indicating the primary material flow). If you need more detail, then each of the nine processes can further be explained separately in a lower-level process map.
The term “process map” does not refer to the scope of a process being high-level, low-level, or very detailed. A process map is focused on the activity flow, order, or sequence and interaction.
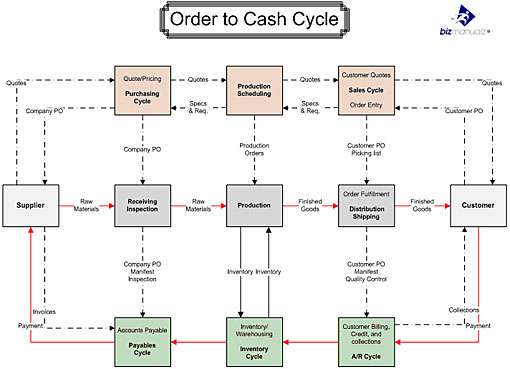
Figure 3: High-level process maps show all core processes within an organization
7 Types of Flow in Accounting
What are the seven types of flow? In the Order to Cash Cycle we see a number of implicit and explicit flows.
- Order Flow – Customer to Sales to Production to Purchasing to Supplier.
- Quote Flow – Same as the Order Flow.
- Material Flow – Supplier to Receiving to Production to Distribution to Customer.
- Information Flow – The dotted line.
- Cash Flow – Customer to Accounts Receivable to Inventory (Purchasing) to Accounts Payable to Supplier.
- Disbursements Flow – Purchasing PO to Accounts Payable to Supplier.
- Collections Flow – Customer PO to Sales to Distribution to Accounts Receivable to Customer.
Low-Level Process Map
The main difference between a high-level and low-level process map is one of scope. In this one of the types of process maps, the process flow has not changed, just the scope of what we are looking at. The Order-To-Cash Cycle has nine processes identified but each process can be further subdivided into sub-processes.
Each sub-process makes up a low-level process map or process flow chart. A low-level process map is an area of a high-level process map that we have zoomed into for more detail.
For example: the Accounts Receivable Policy Template (A/R) Cycle is comprised of customer billing, credit, and collections. If we take a look at just the credit approval portion (Figure 4) of the whole A/R cycle we see that there are five main steps: sales call, order entry, credit check, review A/R balance, and calculate credit terms.
There are three UML symbols used: square for process steps, diamond for decisions and an odd looking square with a curved bottom representing data. Decision diamonds produce an alternative flow that here represents either an “OK” or “Bad Credit” decision, which requires a new sales call to resolve.
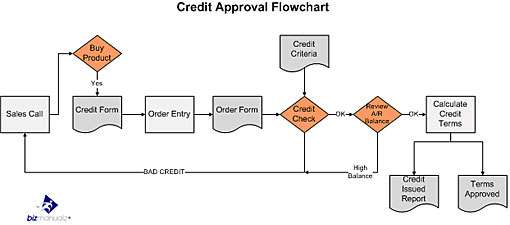
Figure 4: Credit Approval Process Flow Chart
Low-level process maps can provide a lot of detail for analysis and can be used in place of textual procedures for simple processes. If you want to “lean out” your documentation for ISO 9001 then flowcharts can simplify your procedures and reduce unnecessary paperwork. Organizations with highly trained employees can benefit by using simple process maps.
One problem with low-level process maps is that sometimes it is hard to determine who is responsible for which activity. Another is that they may not conform very well to the SIPOC format we prefer. In this case a Cross Functional or “Swim Lanes” Map can be used to convey individual responsibilities or departmental roles within an organization.
Cross Functional or “Swim Lanes” Map
Another one of the types of process maps is a Cross Functional or “Swim Lanes” Map. These have the same UML flowchart symbols used in the low-level process map example. Only now, four cross functional swim lanes have been used to identify who is responsible for each element, decision or data.
You can have any number of swim lanes in your map, although as a practical limit you may want to make it fewer than ten for clarity. In Figure 5, the first band, the customer is clearly responsible for making a “buying” decision and must complete the credit form.
The sales department is the second band and must respond to sales calls, receive the credit information (form), enter the order, and produce an order form. The order form is sent to the credit department, which compares the data to the credit criteria issued by management.
If everything looks “OK” then credit reviews the customer’s existing A/R balances for credit capacity, and then calculates the credit terms. Management is responsible for preparing a “credit issued” report and overseeing the credit approval process.
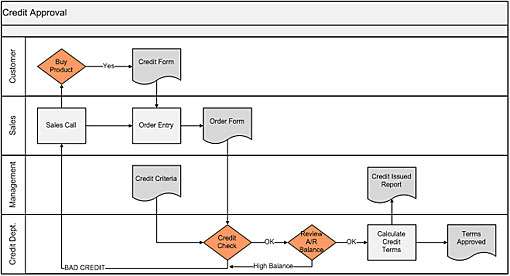
Figure 5: Credit Approval Swim Lanes Map
Swim lanes are really good at depicting responsibilities and with no loss in the low-level process flowchart information. Suppliers and customers are obvious and it does conform to our SIPOC format.
Although, we still see alternative back flow present in the “bad credit?” decision. The problem with alternative flow is they can make it hard to follow the process.
A better method would be to use “single-piece?” flow (the path a single product takes without alternative flows) and eliminate alternative flows such as in a Document Map. You can also learn about other types of process maps such as Document and Value Stream maps in other articles on our site.
Swim lane maps and document maps are descriptive rather than prescriptive: we use them to communicate what is happening today, not what we’d like to happen or what should be taking place. To change the existing process, we need to map the activities at each step and critique them for the value they add to the process.
Document Maps
A document map displays visually what information you should expect to receive, and from whom. It also shows you what information you are expected to produce for someone else. Document maps show all input and output documents used. Document Maps are an expanded SIPOC format. Each row of the SIPOC flow represents:
- Supplier ->
- Input (yellow) ->
- Process Step (light green) ->
- Output (blue) ->
- Customer
Effectiveness criteria and performance objectives are listed at the bottom. Your effectiveness criteria represent your Key Performance Indicators (KPI), metrics, or measures for your process. If you are planning on continuous improvement (to conform to ISO 9001) then you should identify your metrics and your performance objectives.
We have also introduced PDCA or Plan, Do, Check, Act structure to the process steps:
- “Plan” is performed as part of the prior “Act” step where credit criteria are determined.
- “Do” occurs when the sales person gets the order and starts entering it in the system, credit checks are performed and terms calculated.
- “Check” occurs when the credit issued is reviewed along with the credit criteria.
- And finally, “Act” occurs when new credit criteria are issued.
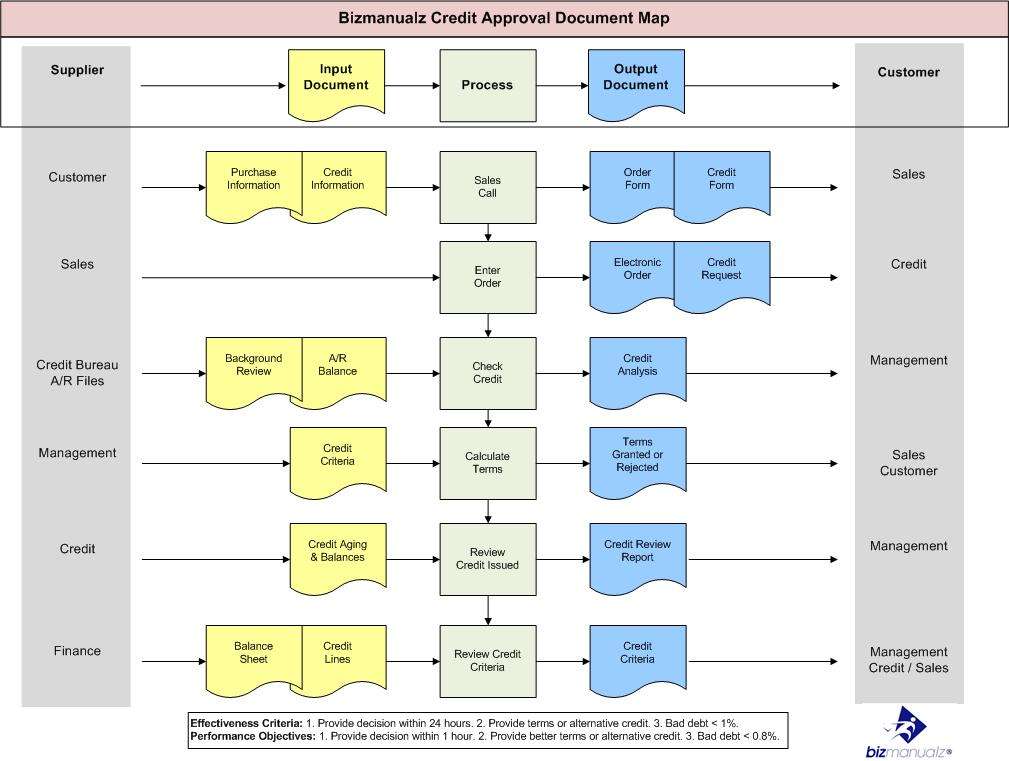
Figure 6: Bizmanualz Credit Approval Document Map
Document maps come in handy in quality systems like ISO 9001, which require that certain records (like product requirements) be created and maintained. Since they show the records your process creates, documents maps remind and remind process owners to generate output documents without having to name someone as the “document police.”
And if you’re in the middle of the process, document maps can tell you if you have the inputs you need to do your job. Figure 6: Bizmanualz Credit Approval Document Map is an example.
It clearly shows the input and output documents, hence the name document map. Document maps provide a lot of data detail but can be short on activity details. Text based procedures are much better at depicting individual tasks and methods. But we can also use an Activity Map.
Activity Map or Value Stream Map
Activity maps or Value Stream Maps are used in lean implementations to depict process tasks as single-piece flow and with as much detail as you can capture. The whole purpose of an Activity Map is to capture enough information so that you can identify the tasks that are clearly adding value and those that are of questionable value.
Activity maps are helpful for architecting and organizing the text before writing a new procedure. Each of the five activities in the Credit Approval process (figure 7.) are listed along the top row in light blue.
Next, an optional tally field totals the number of tasks below each activity (i.e. 4+1). The first number represents the task total and the second number is the lean value-added (green tasks) total.
Then the person or department responsible for the activity is listed with a departmental color code. And finally, the detailed tasks are shown, one per box. Value-added tasks are color coded green, clearly wasteful tasks are coded red, and all the white boxes represent possible waste, or steps that can be eliminated through lean process improvement events.
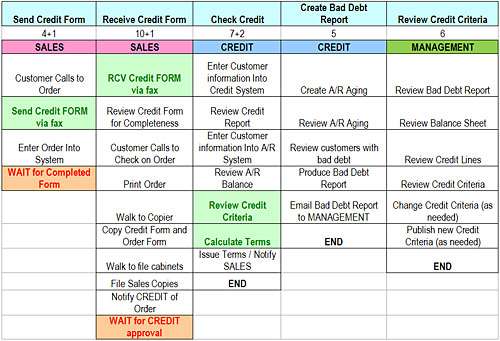
Figure 7: Value Stream Map – Activity Map
Activity maps provide sufficient details for process improvement and can also be augmented with task timing data, which can be used to quantify time and cost savings. All you need is a spreadsheet and you can start making activity maps. Unfortunately, activity maps are just OK at training or communicating how a process works. Work flow diagrams are much better for training workers and communicating processes.
Process Maps Communicate
Keep in mind that process maps only communicate the process steps. They are not active on their own. If the process changes then you must update the process map to communicate the new changes. Process mapping is about communicating your process to others, so you can achieve your goals.
The Purpose of a Process Map
A shared set of fundamental procedures serves as the cornerstone of all enterprises. Process maps are classified into several categories. We addressed some of these categories by examining seven distinct types of process maps and how they are used to depict a process.
Learn to develop and manage your process better. Bizmanualz can teach you how to determine your processes and improve your processes using lean ISO consulting and training services.


This article on Process maps and their importance is very useful. I’ve picked up a thing or two.
[…] More | Save image […]
[…] Process Maps (aka Flowcharts, полезно для анализа процессов). […]