How to Use Workflow Diagrams and Rendered Process Maps
Workflow diagrams and Rendered Process Maps translate abstract UML, or Unified Modeling Language, symbols of squares and diamonds into graphical images to explain your business process visually. This article explains how to use workflow diagrams and rendered process maps.
Workflow Diagrams
Workflow diagrams translate abstract UML, or Unified Modeling Language, symbols of squares and diamonds into graphical images, which are used to tell a more complete story than engineering notation communicates. Engineers are used to thinking conceptually and using symbols, but the workers in the field may need something less abstract and more concrete. Task-level communications require more clarity and work much better when we get closer to reality.
Credit Approval Process
Workflow diagrams can easily be produced with MS Visio, like the drawing of the credit approval process in a workflow diagram format (Figure 1), which appears to bring the process to life. Workers might see themselves in the workflow and may see how the process works. Microsoft Visio contains a work flow diagram library (including the examples shown here) that can be used for drawing more than just process maps.

Figure 1: Credit Approval Process Work Flow Diagram
Workflow diagrams are great as a basis for developing MS-PowerPoint training materials for workers and can be used in combination with other process map types to provide process information from different perspectives. This same map could be drawn using swim lanes to communicate responsibilities more clearly.
Workflow diagrams are more realistic than process flowcharts, but there might still be room for improvement. Is there a more realistic process map? Let’s look at a rendered process map.
Rendered Process Map
A rendered process map (Figure 2) is similar to a workflow diagram. It uses many of the same symbols to communicate process flows and activities, but it is not limited to just those symbols. Graphics, colors, and images can be combined to produce a more detailed and realistic map that everyone can relate to. A graphics package beyond MS Visio, like Corel Draw with more detail, will be needed for rendered process maps.
The “material order request & receiving” process depicts an inventory storage location or warehouse that is not physically at or near the point of sale. Activities are labeled “A” through “I” and are described at the top of the map.
Different process flows are color coded: green for customer approval within the purchasing sub-process, purple for distribution, grey for order processing, and orange for inventory picking. The orange triangles symbolize time waste.
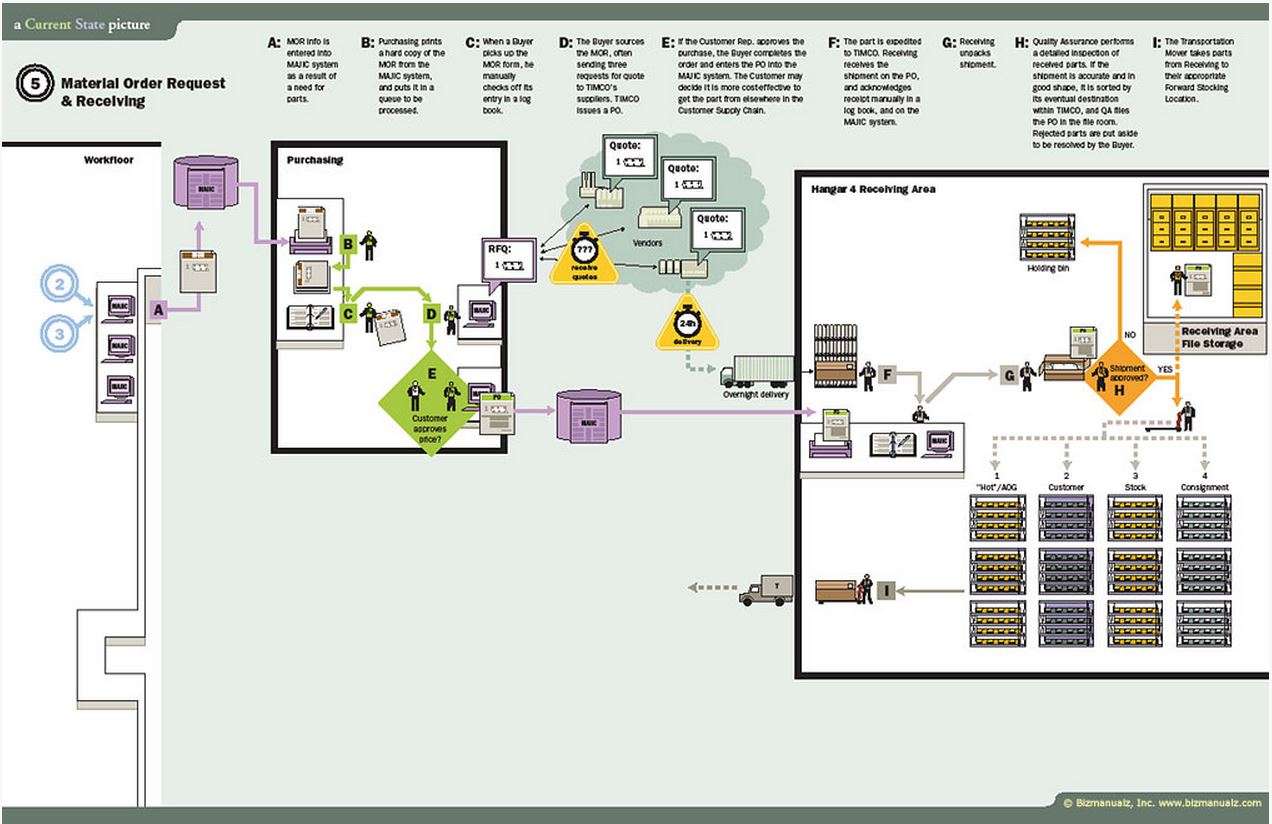
Figure 2: Material Order Request & Receiving Rendered Process Map
Business Process Mapping
There are many different types of process maps used in business process mapping. Each type of process map serves a specific purpose and works really well in certain situations; some work better in certain situations than others. Which one(s) might work well in your company’s — or your department’s — situation? Can you see these types of tools making your work life easier, and helping your company run more efficiently and effectively? Please share your thoughts and opinions with us.


Leave a Reply